
In the ever-evolving landscape of financial markets, traders constantly seek reliable tools and methodologies to enhance their decision-making process. Employing trading indicators is a common approach, with many finding value in combining different indicators to create a robust trading strategy. This article delves into the Chaikin Money Flow (CMF), a volume-weighted oscillator that seeks to measure the amount of money flowing into or out of a security over a specific period. Understanding how the Chaikin Money Flow operates and how it can be used to confirm potential trades can provide a significant advantage.
Chaikin Money Flow: Is Volume Confirming Your Trade?
The Chaikin Money Flow (CMF) is a technical indicator designed by Marc Chaikin to measure the buying and selling pressure of a security over a given period. It is based on the premise that price movement alone does not tell the whole story; volume provides valuable insight into the conviction behind price trends. By analyzing the relationship between price and volume, the CMF aims to identify potential buy or sell signals, helping traders make more informed decisions.
Understanding the Chaikin Money Flow
The CMF calculation involves several steps, ultimately resulting in a single value that oscillates above and below a zero line. This value indicates the strength and direction of money flow, making it a useful tool for confirming trends and identifying potential reversals.
Key Components of the CMF
To understand the CMF, it is crucial to grasp the components that contribute to its calculation:
- Money Flow Multiplier (MFM): This is the first step in calculating the CMF. The MFM assesses the relationship between the closing price and the high-low range for the period. The formula is: ((Close - Low) - (High - Close)) / (High - Low). This value ranges from -1 to +1.
- Money Flow Volume (MFV): The MFV is the product of the MFM and the volume for that period. It represents the actual amount of money flowing into or out of the security on that day. The formula is: Money Flow Multiplier x Volume.
- CMF Calculation: The CMF is calculated by summing the MFV over a specified period (typically 20 or 21 days) and then dividing it by the total volume for the same period. The formula is: 20-Day CMF = (Sum of Money Flow Volume for 20 Days) / (Sum of Volume for 20 Days).
Interpreting CMF Values
The CMF oscillates around a zero line, and the direction and magnitude of its movement provide valuable information about the buying and selling pressure in the market.
- CMF Above Zero: A CMF value above zero indicates that buying pressure is dominant. This suggests that more money is flowing into the security, potentially signaling an upward trend or a bullish sentiment. The higher the CMF value, the stronger the buying pressure.
- CMF Below Zero: A CMF value below zero suggests that selling pressure is dominant. This indicates that more money is flowing out of the security, potentially signaling a downward trend or a bearish sentiment. The lower the CMF value, the stronger the selling pressure.
- Zero Line Crossings: Crossovers of the zero line can be significant. A move from below zero to above zero may indicate the start of an upward trend, while a move from above zero to below zero may signal the beginning of a downward trend.
Using CMF to Confirm Trades
The true power of the CMF lies in its ability to confirm or contradict signals generated by other technical indicators or price action analysis. By incorporating volume into the analysis, the CMF can help filter out false signals and improve the accuracy of trading decisions.
Confirming Uptrends
When analyzing a potential uptrend, look for the following signals:
- Price Making Higher Highs and Higher Lows: This indicates a clear upward trend.
- CMF Above Zero: The CMF should ideally be above zero, confirming that buying pressure is supporting the upward trend.
- Increasing CMF: A rising CMF suggests that buying pressure is increasing, further validating the uptrend.
If the price is making higher highs but the CMF is failing to rise or is declining, it could be a sign of divergence, indicating a potential weakening of the uptrend and a possible reversal.
Confirming Downtrends
When analyzing a potential downtrend, look for the following signals:
- Price Making Lower Highs and Lower Lows: This indicates a clear downward trend.
- CMF Below Zero: The CMF should ideally be below zero, confirming that selling pressure is driving the downward trend.
- Decreasing CMF: A falling CMF suggests that selling pressure is increasing, further validating the downtrend.
If the price is making lower lows but the CMF is failing to decline or is rising, it could be a sign of divergence, indicating a potential weakening of the downtrend and a possible reversal.
Divergence with Price Action
Divergence occurs when the price action and the CMF move in opposite directions. This can be a powerful signal of a potential trend reversal. There are two main types of divergence:
- Bullish Divergence: This occurs when the price makes lower lows, but the CMF makes higher lows. This indicates that while the price is declining, the selling pressure is weakening, potentially signaling a reversal to the upside.
- Bearish Divergence: This occurs when the price makes higher highs, but the CMF makes lower highs. This indicates that while the price is rising, the buying pressure is weakening, potentially signaling a reversal to the downside.
It is important to note that divergence is not always a reliable signal on its own. It should be used in conjunction with other technical indicators and price action analysis to confirm the potential reversal.
Combining CMF with Other Trading Indicators
To enhance the effectiveness of the CMF, it is often beneficial to combine it with other trading indicators. This can provide a more comprehensive view of the market and improve the accuracy of trading decisions.
CMF and Moving Averages
Moving averages are trend-following indicators that smooth out price data to identify the direction of the trend. Combining the CMF with moving averages can help confirm the strength and validity of the trend.
- Uptrend Confirmation: If the price is above a moving average and the CMF is above zero, it reinforces the bullish sentiment.
- Downtrend Confirmation: If the price is below a moving average and the CMF is below zero, it reinforces the bearish sentiment.
Crossovers of the moving average can also be used as entry or exit signals, with the CMF providing additional confirmation.
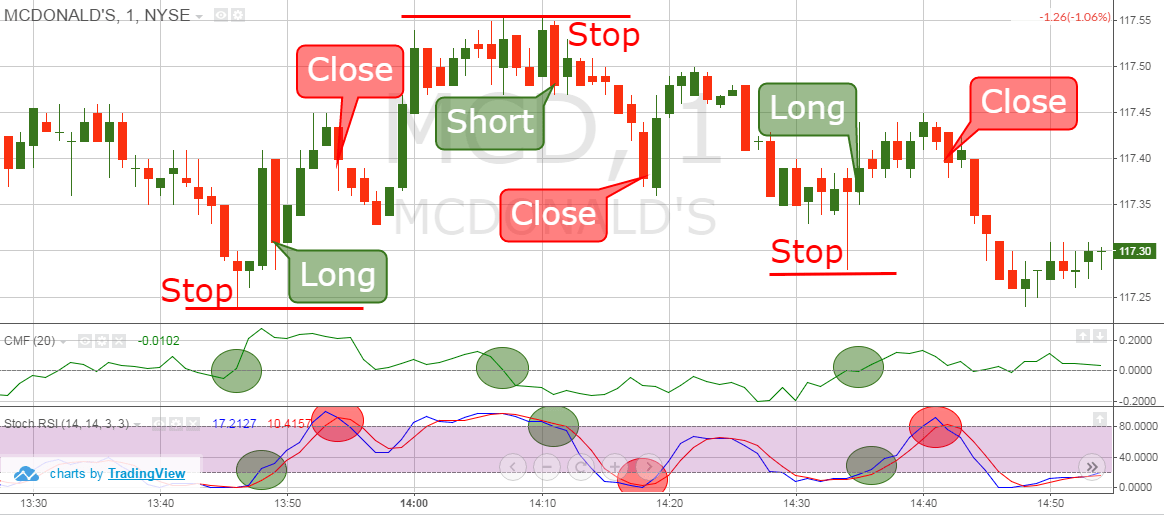
CMF and Relative Strength Index (RSI)
The Relative Strength Index (RSI) is a momentum oscillator that measures the speed and change of price movements. It ranges from 0 to 100 and is often used to identify overbought and oversold conditions.
- Overbought Conditions: If the RSI is above 70 and the CMF is declining, it could be a sign of weakening buying pressure and a potential reversal to the downside.
- Oversold Conditions: If the RSI is below 30 and the CMF is rising, it could be a sign of weakening selling pressure and a potential reversal to the upside.
Divergence between the RSI and the CMF can also provide valuable signals. For example, if the price is making new lows but the RSI and CMF are both making higher lows, it could be a strong indication of a bullish reversal.
CMF and Fibonacci Retracement Levels
Fibonacci retracement levels are horizontal lines that indicate potential support and resistance levels based on Fibonacci ratios. Combining the CMF with Fibonacci retracement levels can help identify high-probability trading opportunities.
- Support Levels: If the price is approaching a Fibonacci support level and the CMF is rising, it could be a sign that buying pressure is increasing and the support level is likely to hold.
- Resistance Levels: If the price is approaching a Fibonacci resistance level and the CMF is declining, it could be a sign that selling pressure is increasing and the resistance level is likely to hold.
Traders can also look for confluence between Fibonacci retracement levels and CMF signals. For example, if a price is retracing to a 61.8% Fibonacci level and the CMF is showing bullish divergence, it could be a strong buy signal.
Practical Trading Strategies Using CMF
Several trading strategies can be developed using the CMF as a primary or secondary indicator. These strategies aim to capitalize on the information provided by the CMF to make informed trading decisions.
Trend Confirmation Strategy
This strategy involves using the CMF to confirm the direction and strength of an existing trend. The steps are as follows:
- Identify the Trend: Use moving averages or trendlines to identify the direction of the trend.
- CMF Confirmation: Check the CMF to confirm the strength of the trend. For an uptrend, the CMF should be above zero and rising. For a downtrend, the CMF should be below zero and falling.
- Entry Signal: Enter a long position if the price is in an uptrend and the CMF is confirming the buying pressure. Enter a short position if the price is in a downtrend and the CMF is confirming the selling pressure.
- Stop-Loss: Place a stop-loss order below a recent swing low for long positions and above a recent swing high for short positions.
- Profit Target: Set a profit target based on a multiple of the risk or at a key support or resistance level.
Divergence Trading Strategy
This strategy involves using the CMF to identify potential trend reversals based on divergence between price action and the CMF. The steps are as follows:
- Identify Divergence: Look for bullish or bearish divergence between the price and the CMF.
- Confirmation: Wait for confirmation of the divergence, such as a break of a trendline or a crossover of a moving average.
- Entry Signal: Enter a long position if there is bullish divergence and confirmation. Enter a short position if there is bearish divergence and confirmation.
- Stop-Loss: Place a stop-loss order below a recent swing low for long positions and above a recent swing high for short positions.
- Profit Target: Set a profit target based on a multiple of the risk or at a key support or resistance level.
Range Trading Strategy
This strategy involves using the CMF to identify potential buying and selling opportunities within a defined trading range. The steps are as follows:
- Identify the Range: Identify a period of consolidation where the price is trading within a defined range.
- CMF Signals: Look for the CMF to reach extreme levels within the range. A high CMF value may indicate overbought conditions, while a low CMF value may indicate oversold conditions.
- Entry Signal: Enter a short position when the CMF reaches a high level within the range, indicating potential selling pressure. Enter a long position when the CMF reaches a low level within the range, indicating potential buying pressure.
- Stop-Loss: Place a stop-loss order just above the range high for short positions and just below the range low for long positions.
- Profit Target: Set a profit target at the opposite end of the range.
Risk Management Considerations
While the CMF can be a valuable tool for confirming trades, it is essential to implement proper risk management techniques to protect capital. Here are some key risk management considerations:
- Stop-Loss Orders: Always use stop-loss orders to limit potential losses. The stop-loss should be placed at a level that invalidates the trading setup.
- Position Sizing: Determine the appropriate position size based on the risk tolerance and account size. Do not risk more than a small percentage of the account on any single trade.
- Diversification: Diversify the portfolio by trading different assets and using different trading strategies. This can help reduce the overall risk.
- Backtesting: Before implementing a trading strategy with real capital, backtest it on historical data to assess its performance and identify potential weaknesses.
- Staying Informed: Stay informed about market news and economic events that could impact the trades. Avoid trading during periods of high volatility or uncertainty.
Advantages and Limitations of the CMF
Like any technical indicator, the CMF has its advantages and limitations. Understanding these can help traders use the indicator more effectively.
Advantages
- Confirmation of Trends: The CMF can help confirm the strength and validity of existing trends.
- Identification of Divergence: The CMF can identify potential trend reversals through divergence with price action.
- Volume-Weighted Analysis: The CMF incorporates volume into the analysis, providing a more comprehensive view of the market.
- Easy to Interpret: The CMF is relatively easy to understand and interpret, making it accessible to traders of all levels.
Limitations
- Lagging Indicator: The CMF is a lagging indicator, meaning it reacts to past price and volume data. This can lead to delayed signals.
- False Signals: The CMF can generate false signals, particularly in volatile or choppy markets.
- Limited Use in Isolation: The CMF is most effective when used in conjunction with other technical indicators and price action analysis.
- Parameter Sensitivity: The CMF is sensitive to the chosen period. Different periods can produce different signals.
Conclusion
The Chaikin Money Flow is a valuable technical indicator that can provide insights into the buying and selling pressure in the market. By incorporating volume into the analysis, the CMF can help confirm trends, identify potential reversals, and improve the accuracy of trading decisions. However, it is essential to understand the limitations of the CMF and use it in conjunction with other technical indicators and risk management techniques.
The CMF is most effective during periods of strong trending markets or when used to identify potential reversals through divergence. Traders should avoid using the CMF in isolation and should always backtest their strategies before implementing them with real capital. With proper understanding and application, the Chaikin Money Flow can be a powerful tool in any trader's arsenal.
Before implementing this or any trading strategy, it is highly recommended to practice using a demo account. This allows one to become familiar with the indicator's behavior in various market conditions without risking actual capital. Experimenting with different parameters and combinations with other trading indicators can lead to a more personalized and effective trading approach. Careful observation and analysis, combined with sound risk parameters, are essential for potentially successful application of this and other trading indicators.
🤖 AI-Powered Trading Indicators
Win Up To 93% of Trades With the #1 Most Profitable Indicators
Unlock the power of artificial intelligence and take your trading to the next level. Our VIP Trading Indicators are designed to help you dominate any market — Forex, Crypto, Stocks — with up to 93% accuracy.
Gain instant 24/7 access to 5+ powerful, battle-tested indicators built to predict market trends with precision. Whether you're a beginner or an expert, these tools are optimized for all skill levels and work on any device.
✓ 30-Day Money Back Guarantee — Try Risk-Free!