
Navigating the complexities of financial markets demands the strategic use of robust trading tools. Combining different types of tools enhances their individual power, offering potentially more reliable and accurate trading signals. The Super Trend, a popular trend-following indicator, can be significantly improved through strategic application and complementary tools. This article explores how to use the Super Trend, and further enhance its performance, to identify favorable buying and selling opportunities.
Understanding the Super Trend Indicator
The Super Trend is a trend-following indicator, plotted directly on a price chart, designed to identify the current market trend. Unlike moving averages, which lag price action, the Super Trend dynamically adjusts its position based on price volatility. It uses the Average True Range (ATR) to calculate its bands, making it responsive to market fluctuations.
At its core, the Super Trend is composed of two primary components:
The Basic Upper Band: Calculated above the price, this band initially acts as a resistance level. The Basic Lower Band: Calculated below the price, this band initially acts as a support level.
These bands are derived using the ATR, which measures market volatility. The ATR value is multiplied by a factor (commonly 3) and added to or subtracted from the average price. This ensures that the bands widen during periods of high volatility and contract during periods of low volatility.
The indicator works by alternating between the upper and lower bands. When the price closes above the upper band, the Super Trend switches to the lower band, indicating a potential buy signal. Conversely, when the price closes below the lower band, the Super Trend switches to the upper band, signaling a potential sell signal. This dynamic adjustment helps traders stay aligned with the prevailing trend while also accounting for market volatility.
The Super Trend offers several advantages:
Simplicity: The visual nature of the indicator makes it easy to interpret. A glance at the chart provides a quick understanding of the current trend. Adaptability: The ATR component allows the Super Trend to adapt to varying levels of market volatility, making it useful across different assets and timeframes. Clear Signals:The buy and sell signals are clearly defined by the indicator's position relative to the price.
Enhancing the Super Trend with Additional Trading Indicators
While the Super Trend is effective on its own, its performance can be further refined by integrating it with other trading indicators. Combining multiple tools addresses the limitations of relying solely on a single tool and can increase the probability of successful trades.
Here are some key trading indicators that can complement the Super Trend:
Relative Strength Index (RSI): A momentum oscillator that measures the speed and change of price movements. It ranges from 0 to 100, with readings above 70 indicating overbought conditions and readings below 30 indicating oversold conditions. Moving Averages: Used to smooth out price data and identify the direction of the trend. Common types include Simple Moving Averages (SMA) and Exponential Moving Averages (EMA). Volume: Measures the amount of an asset traded in a given period. It confirms the strength of a trend or reversal. Moving Average Convergence Divergence (MACD): A trend-following momentum indicator that shows the relationship between two moving averages of a security’s price. Bollinger Bands:Bands plotted at standard deviation levels above and below a moving average. They indicate potential areas of support and resistance and can signal volatility breakouts.
Combining the Super Trend with RSI for Enhanced Signals
The Relative Strength Index (RSI) is a valuable tool for identifying overbought and oversold conditions. When combined with the Super Trend, the RSI acts as a filter, helping to validate or reject signals generated by the Super Trend. This combination can reduce false signals and increase the reliability of trades.
Here’s how the combination works:
Buy Signal: When the Super Trend indicates a buy signal (i.e., the price closes above the upper band and the indicator switches to the lower band), confirm that the RSI is not in overbought territory (above 70). If the RSI is below 70, it supports the buy signal. Sell Signal: When the Super Trend indicates a sell signal (i.e., the price closes below the lower band and the indicator switches to the upper band), confirm that the RSI is not in oversold territory (below 30). If the RSI is above 30, it supports the sell signal.
By adding this RSI filter, it avoids taking buy trades when the asset is already overbought or sell trades when the asset is already oversold. This improves the timing of entries and increases the likelihood of profitable outcomes.
Integrating Volume Confirmation with the Super Trend
Volume provides insight into the strength behind price movements. A significant increase in volume during a Super Trend signal can confirm the validity of the signal, while low volume may suggest a weaker signal that should be approached with caution.
Follow these guidelines to integrate volume confirmation:
Buy Signal: When the Super Trend signals a buy, look for a corresponding increase in volume. A substantial increase in volume indicates strong buying pressure, supporting the uptrend. Sell Signal: When the Super Trend signals a sell, look for a corresponding increase in volume. A substantial increase in volume indicates strong selling pressure, supporting the downtrend.
If the volume is low during a Super Trend signal, it may suggest that the price movement is not strongly supported by market participants. In such cases, it is prudent to wait for further confirmation before entering a trade or to reduce the position size to mitigate risk.
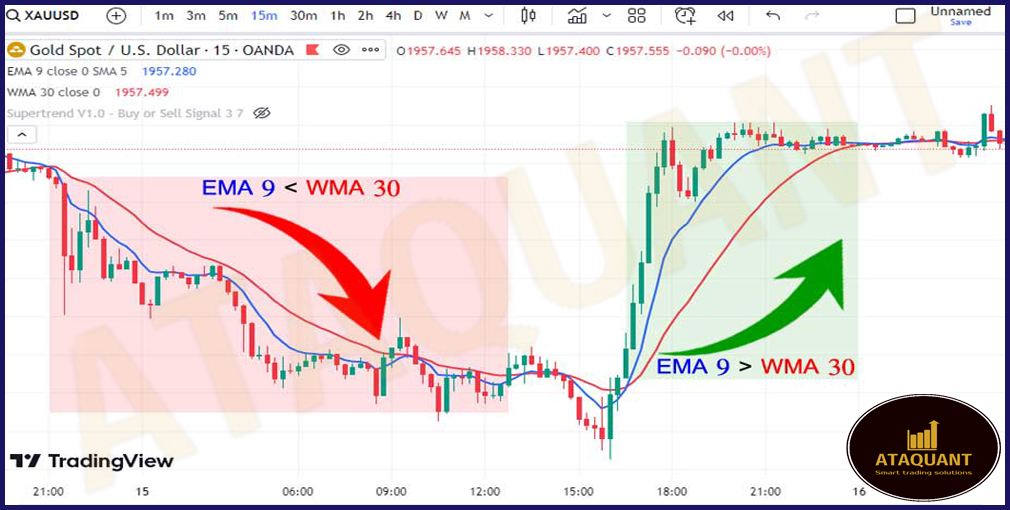
Applying Moving Averages to Validate Super Trend Signals
Moving averages help smooth out price data and identify the overall trend direction. Using moving averages in conjunction with the Super Trend can provide a broader context for the signals generated by the Super Trend. For example, if the price is above a long-term moving average (e.g., 200-day SMA), the overall trend is likely up. In this case, focus on Super Trend buy signals while being more cautious about sell signals.
Similarly, if the price is below a long-term moving average, the overall trend is likely down, and focus on Super Trend sell signals. Aligning trades with the prevailing trend identified by moving averages can increase the probability of success.
Incorporating MACD for Trend Confirmation
The Moving Average Convergence Divergence (MACD) indicator helps identify changes in the strength, direction, momentum, and duration of a trend in a stock's price. Using the MACD alongside the Super Trend can provide additional confirmation of trend direction and potential reversals.
To use MACD with the Super Trend:
Buy Signal: When the Super Trend signals a buy, look for the MACD line to cross above the signal line. This crossover indicates bullish momentum and supports the buy signal. Sell Signal: When the Super Trend signals a sell, look for the MACD line to cross below the signal line. This crossover indicates bearish momentum and supports the sell signal.
Divergence between the price and the MACD can also provide valuable insights. For example, if the price is making higher highs but the MACD is making lower highs, it may signal a weakening uptrend and a potential reversal.
Using Bollinger Bands to Anticipate Breakouts
Bollinger Bands consist of a moving average and two bands plotted at standard deviations above and below the moving average. They indicate the volatility of the market. When the bands narrow, it signals a period of low volatility, often preceding a significant price movement.
Here’s how to use Bollinger Bands with the Super Trend:
Squeeze: Look for periods when the Bollinger Bands narrow, indicating a squeeze.This suggests that volatility is low and a breakout is imminent. Breakout: When the Super Trend signals a buy, and the price breaks above the upper Bollinger Band, it confirms the strength of the uptrend. Conversely, when the Super Trend signals a sell, and the price breaks below the lower Bollinger Band, it confirms the strength of the downtrend.
The combination of a Bollinger Band squeeze and a Super Trend signal can be a powerful indication of a potential trade opportunity.
Setting Stop-Loss Orders with the Super Trend
Effective risk management is crucial for preserving capital and maximizing profits. Setting stop-loss orders is an essential aspect of risk management. The Super Trend itself can be used to determine appropriate stop-loss levels. For buy trades, place the stop-loss order just below the Super Trend line. This way, if the price reverses and breaks below the Super Trend, the position is automatically closed, limiting potential losses.
For sell trades, place the stop-loss order just above the Super Trend line. This strategy ensures that the stop-loss level adjusts dynamically with the market, reflecting changes in volatility and trend direction.
Determining Profit Targets Using ATR
The Average True Range (ATR), which is integral to the Super Trend calculation, can also be used to determine realistic profit targets. Since the ATR measures market volatility, it can provide an estimate of how much the price is likely to move within a given period.
To set profit targets using ATR, multiply the ATR value by a factor (e.g., 1.5 or 2) and add it to the entry price for buy trades or subtract it from the entry price for sell trades. This method adjusts profit targets based on market volatility, ensuring that the targets are realistic and achievable.
Backtesting the Super Trend Strategy
Backtesting involves testing a trading strategy on historical data to evaluate its performance. Backtesting the Super Trend strategy is crucial for understanding its effectiveness across different assets and timeframes. It helps refine the parameters and identify potential weaknesses.
When backtesting the Super Trend, consider the following:
Different Timeframes: Test the strategy on various timeframes, such as daily, hourly, and 15-minute charts, to determine the optimal timeframe for different assets. Various Market Conditions: Evaluate the performance during trending, ranging, and volatile market conditions. Parameter Optimization:Experiment with different ATR periods and multipliers to find the settings that yield the best results.
Backtesting provides valuable insights into the strategy’s win rate, profit factor, and maximum drawdown, helping traders make informed decisions about its implementation.
Avoiding False Signals During News Events
News events can cause significant price volatility and trigger false signals in trading indicators. It’s prudent to be cautious during major economic announcements, earnings releases, and geopolitical events.
Here are some strategies to avoid false signals during news events:
Avoid Trading: Refrain from opening new positions shortly before and after major news releases. Widen Stop-Losses: If holding existing positions, widen stop-loss orders to account for increased volatility. Confirm Signals:Require additional confirmation from other indicators before acting on Super Trend signals during news events.
Staying informed about upcoming news events and their potential impact on the market can help avoid costly trading mistakes.
Adapt the Super Trend Strategy
No trading strategy is foolproof, and the Super Trend is no exception. It's important to recognize situations where the Super Trend may be less effective, such as during choppy or sideways markets. In such conditions, the indicator may generate frequent false signals, leading to losses.
To mitigate this, consider the following:
Market Conditions: Avoid using the Super Trend during choppy or sideways markets. Confirmation: Require additional confirmation from other indicators or price action before acting on Super Trend signals. Reduce Position Size:Reduce the position size when trading in uncertain market conditions.
Adapting to changing market dynamics and being flexible with the trading strategy can significantly improve performance.
Conclusion
The Super Trend offers a straightforward and adaptable method for identifying market trends and generating trading signals. While effective on its own, its power is amplified when used in conjunction with other tools such as the RSI, volume, moving averages, MACD, and Bollinger Bands. This enhanced approach provides a more comprehensive view of the market, reducing the likelihood of false signals and increasing the potential for profitable trades. By integrating these complementary tools, traders can improve the timing of entries and exits, manage risk effectively, and adapt to changing market conditions.
The Super Trend strategy is most effective during trending market conditions. It may be less reliable during periods of consolidation or high volatility. Therefore, understanding the market context and adapting the strategy accordingly is essential. Experiment with different settings, tools, and timeframes to find the approach that best suits individual trading style and risk tolerance.
Before implementing this strategy with real capital, it is recommended to test it thoroughly on a demo account. This allows traders to familiarize themselves with the strategy, refine their skills, and validate its performance without risking actual funds. Consistent practice and continuous learning are key to mastering the Super Trend strategy and achieving success in the financial markets.
🤖 AI-Powered Trading Indicators
Win Up To 93% of Trades With the #1 Most Profitable Indicators
Unlock the power of artificial intelligence and take your trading to the next level. Our VIP Trading Indicators are designed to help you dominate any market — Forex, Crypto, Stocks — with up to 93% accuracy.
Gain instant 24/7 access to 5+ powerful, battle-tested indicators built to predict market trends with precision. Whether you're a beginner or an expert, these tools are optimized for all skill levels and work on any device.
✓ 30-Day Money Back Guarantee — Try Risk-Free!