
In the complex realm of financial markets, successful navigation often hinges on the ability to decipher underlying trends and anticipate future movements. Numerous methods are employed by analysts and investors alike to achieve this edge, with indicator-based strategies remaining a cornerstone of technical analysis. This article delves into the TRIX indicator, exploring its construction, interpretation, and application in the cryptocurrency market, known for its extreme volatility. By understanding the nuances of the TRIX indicator, traders can potentially enhance their decision-making processes and improve their overall performance.
Understanding the TRIX Indicator
The TRIX indicator, short for Triple Exponentially Smoothed Average, is a momentum oscillator used in technical analysis to identify potential turning points in the price of an asset. It was developed by Jack Hutson and is designed to filter out noise and provide a clearer view of the prevailing trend. Unlike simple moving averages, which react slowly to price changes, the TRIX indicator employs a triple smoothing process that reduces the impact of short-term fluctuations, offering a more stable and reliable signal. The TRIX is primarily used to identify overbought and oversold conditions, as well as to generate buy and sell signals based on crossovers with its signal line. It’s an important addition to the suite of available Trading Indicators.
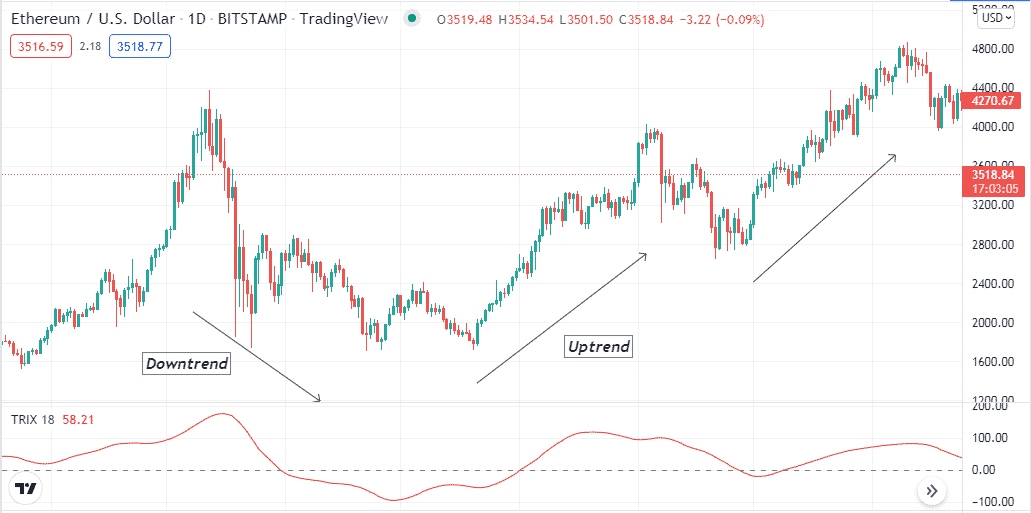
The TRIX indicator oscillates around a zero line, with positive values indicating an upward trend and negative values suggesting a downward trend. The greater the magnitude of the TRIX value, the stronger the trend is considered to be. Crossovers of the TRIX line with its signal line (typically a 9-period moving average of the TRIX) are often interpreted as potential trading signals. A crossover above the signal line suggests a buy opportunity, while a crossover below the signal line suggests a sell opportunity.
Calculating the TRIX Indicator
The calculation of the TRIX indicator involves several steps, all designed to smooth out the price data and reduce noise. The process begins with calculating a single exponentially smoothed average of the asset's closing prices. This result is then exponentially smoothed again, and finally, the output from the second smoothing is smoothed a third time. This triple smoothing process significantly reduces the impact of short-term price fluctuations.
Once the triple exponentially smoothed average (TES) is calculated, the TRIX is determined by measuring the percentage change in the TES from one period to the next. The formula for calculating the TRIX is as follows:
TRIX = [(Current TES - Previous TES) / Previous TES] 100
The period used for the exponential smoothing is a crucial parameter. A shorter period will make the TRIX more sensitive to price changes, potentially generating more frequent but less reliable signals. Conversely, a longer period will make the TRIX less sensitive, resulting in fewer signals, but potentially of higher quality. A common period used is 14, but traders can adjust this parameter to suit their individual trading styles and the specific characteristics of the asset being analyzed.
Interpreting the TRIX Indicator
The TRIX indicator offers several ways to interpret market conditions and potential trading opportunities. One common method is to identify overbought and oversold conditions. When the TRIX value rises to extremely high levels, it suggests that the asset may be overbought and due for a correction. Conversely, when the TRIX value falls to extremely low levels, it suggests that the asset may be oversold and poised for a potential rebound. The specific levels considered to be overbought or oversold can vary depending on the asset and the trader's preferences, but generally, values above +2 or below -2 are often considered significant.
Another method of interpretation involves analyzing crossovers of the TRIX line with its signal line. As mentioned earlier, a crossover above the signal line suggests a buy opportunity, while a crossover below the signal line suggests a sell opportunity. These crossovers indicate a change in the direction of the TRIX and can serve as early warning signals of potential trend reversals.
Divergence between the TRIX indicator and the price of the asset can also provide valuable insights. Bullish divergence occurs when the price of the asset makes lower lows, but the TRIX indicator makes higher lows. This suggests that the downward momentum is weakening and that a potential upward reversal may be imminent. Bearish divergence occurs when the price of the asset makes higher highs, but the TRIX indicator makes lower highs. This suggests that the upward momentum is weakening and that a potential downward reversal may be imminent. These divergences can provide high-probability trading signals, especially when combined with other technical indicators.
Applying the TRIX Indicator to Cryptocurrency Trading
The cryptocurrency market is characterized by its high volatility and rapid price swings. This makes it a challenging but potentially rewarding environment for traders. The TRIX indicator can be a valuable tool for navigating this volatility and identifying potential trading opportunities in the crypto space. Its smoothing properties help to filter out noise and provide a clearer view of the underlying trend, which is particularly useful in a market prone to erratic price movements. The TRIX is one of many available Trading Indicators.
When applying the TRIX indicator to cryptocurrency trading, it is important to consider the specific characteristics of each crypto asset. Some cryptocurrencies may exhibit higher volatility than others, requiring adjustments to the TRIX period or the overbought/oversold levels. It is also crucial to consider the prevailing market conditions and the overall trend of the cryptocurrency market. The TRIX indicator should not be used in isolation but rather in conjunction with other technical indicators and fundamental analysis to make informed trading decisions.
For example, the TRIX can be combined with volume analysis to confirm the strength of a trend. An increase in volume during a TRIX crossover can provide additional confidence in the signal. Similarly, the TRIX can be used in conjunction with other momentum indicators, such as the Relative Strength Index (RSI) or the Moving Average Convergence Divergence (MACD), to identify potential divergences and confirm trend reversals.
Practical Examples of TRIX in Crypto Trading
Let's consider a hypothetical example of using the TRIX indicator to trade Bitcoin (BTC). Suppose the TRIX indicator, using a 14-period setting, crosses above its 9-period signal line. This crossover occurs while Bitcoin is trading within a consolidation range. A trader could interpret this as a potential buy signal, anticipating a breakout from the consolidation range. To manage risk, the trader could set a stop-loss order below the recent swing low. If Bitcoin then breaks out of the range and continues to move upward, the trader can ride the trend until the TRIX indicator generates a sell signal, such as a crossover below its signal line or a reach into overbought territory.
Conversely, consider a scenario where Bitcoin is in an established uptrend, but the TRIX indicator begins to show bearish divergence, making lower highs while Bitcoin makes higher highs. This divergence could signal a weakening of the uptrend and a potential downward reversal. A trader could interpret this as a sell signal or a signal to reduce their long positions. Again, a stop-loss order can be placed above the recent swing high to protect against unexpected price movements. As Bitcoin begins to decline, the trader can profit from the downward move.
These examples illustrate how the TRIX indicator can be used to identify potential trading opportunities in the cryptocurrency market. However, it is important to remember that the TRIX is just one tool among many and should be used in conjunction with other forms of analysis and risk management techniques.
Advantages and Disadvantages of Using TRIX
Like all technical Trading Indicators, the TRIX indicator has its own set of advantages and disadvantages. Understanding these can help traders use the indicator more effectively and avoid potential pitfalls.
Advantages:
- Noise Reduction: The triple smoothing process effectively filters out noise and reduces the impact of short-term price fluctuations, providing a clearer view of the underlying trend.
- Early Signals: TRIX crossovers and divergences can provide early warning signals of potential trend reversals, allowing traders to enter or exit positions before the trend fully reverses.
- Versatility: The TRIX indicator can be used on various timeframes and with different types of assets, making it a versatile tool for traders.
- Confirmation: It is often used to confirm signals generated by other indicators, increasing the confidence in trading decisions.
Disadvantages:
- Lagging Indicator: The smoothing process can cause the TRIX indicator to lag behind price movements, potentially delaying entry or exit signals.
- False Signals: Like all technical indicators, the TRIX indicator can generate false signals, especially in choppy or sideways markets.
- Parameter Sensitivity: The period used for the exponential smoothing can significantly impact the TRIX indicator's sensitivity, requiring careful adjustment based on the asset and market conditions.
- Not a Standalone Tool: The TRIX indicator should not be used in isolation but rather in conjunction with other technical indicators and fundamental analysis.
Risk Management When Using the TRIX Indicator
Risk management is a critical component of successful trading, especially in the volatile cryptocurrency market. When using the TRIX indicator, it is important to implement appropriate risk management techniques to protect capital and minimize potential losses.
One common risk management technique is to use stop-loss orders. A stop-loss order is an order to sell an asset when it reaches a certain price, limiting the potential loss on a trade. When using the TRIX indicator, a stop-loss order can be placed below the recent swing low after a buy signal or above the recent swing high after a sell signal.
Another risk management technique is to diversify the trading portfolio. Diversification involves spreading investments across different assets to reduce the risk of loss. In the cryptocurrency market, diversification can involve trading different cryptocurrencies or investing in other asset classes, such as stocks or bonds.
Position sizing is also an important aspect of risk management. Position sizing involves determining the appropriate amount of capital to allocate to each trade based on the trader's risk tolerance and the potential reward-to-risk ratio of the trade. A smaller position size reduces the potential loss on a trade, while a larger position size increases the potential profit.
Finally, it is important to avoid overtrading. Overtrading involves making too many trades in a short period, often driven by emotions or the desire to recover losses. Overtrading can lead to increased transaction costs and poor decision-making, ultimately eroding capital. Stick to a well-defined trading plan and avoid making impulsive trades.
Backtesting the TRIX Indicator
Before implementing a trading strategy based on the TRIX indicator, it is important to backtest the strategy to evaluate its historical performance and identify potential weaknesses. Backtesting involves applying the trading strategy to historical data and analyzing the results to determine its profitability, win rate, and other key metrics. This is especially vital for any Trading Indicators.
Backtesting can be done manually by reviewing historical charts and simulating trades based on the TRIX indicator's signals. Alternatively, backtesting can be automated using trading software or programming languages like Python. Automated backtesting allows for faster and more comprehensive analysis of the trading strategy.
When backtesting the TRIX indicator, it is important to consider different timeframes, market conditions, and parameter settings. The backtesting results can be used to optimize the trading strategy and identify the most effective settings for the TRIX indicator. It is also important to be aware of the limitations of backtesting. Historical performance is not necessarily indicative of future results, and backtesting cannot account for all the factors that can influence trading performance, such as slippage, commissions, and emotional biases.
The TRIX Indicator and Market Consolidation
The TRIX indicator can be particularly effective during periods of market consolidation. Market consolidation refers to a period when the price of an asset is trading within a narrow range, without a clear upward or downward trend. During these periods, many technical indicators can generate false signals, leading to frustration and losses for traders. However, the TRIX indicator's smoothing properties can help to filter out the noise and identify potential breakouts from the consolidation range.
When the TRIX indicator crosses above its signal line during a period of consolidation, it can signal a potential upward breakout. Conversely, when the TRIX indicator crosses below its signal line during a period of consolidation, it can signal a potential downward breakout. Traders can use these signals to position themselves for the breakout and profit from the subsequent price movement.
It is important to confirm the breakout with other technical indicators and volume analysis. A strong breakout should be accompanied by an increase in volume, confirming the strength of the move. Additionally, traders can look for confirmation from other indicators, such as the RSI or the MACD.
Conclusion
The TRIX indicator is a valuable tool for traders seeking to navigate the complexities of the financial markets, especially in the volatile cryptocurrency landscape. Its triple smoothing process effectively filters out noise and provides a clearer view of the underlying trend, while its crossover and divergence signals can offer early warning signs of potential trend reversals. By understanding the construction, interpretation, and application of the TRIX indicator, traders can potentially enhance their decision-making processes and improve their overall performance.
However, it is crucial to remember that the TRIX indicator is just one tool among many and should be used in conjunction with other technical indicators, fundamental analysis, and risk management techniques. Like all technical indicators, the TRIX indicator has its limitations and can generate false signals, especially in choppy or sideways markets. Therefore, it is important to backtest the trading strategy thoroughly and to implement appropriate risk management measures to protect capital and minimize potential losses.
The TRIX indicator is most effective when used during periods of market consolidation, as its smoothing properties can help to filter out the noise and identify potential breakouts. By combining the TRIX indicator with other tools and techniques, traders can increase their chances of success in the dynamic and challenging world of cryptocurrency trading.
It is highly recommended to test strategies on a demo account before deploying them with actual capital. This allows you to familiarize yourself with the indicator’s behavior and refine your trading plan in a risk-free environment.
🤖 AI-Powered Trading Indicators
Win Up To 93% of Trades With the #1 Most Profitable Indicators
Unlock the power of artificial intelligence and take your trading to the next level. Our VIP Trading Indicators are designed to help you dominate any market — Forex, Crypto, Stocks — with up to 93% accuracy.
Gain instant 24/7 access to 5+ powerful, battle-tested indicators built to predict market trends with precision. Whether you're a beginner or an expert, these tools are optimized for all skill levels and work on any device.
✓ 30-Day Money Back Guarantee — Try Risk-Free!