
In the realm of financial markets, astute traders constantly seek strategies that offer a decisive advantage. A prevalent method involves using a combination of technical indicators to pinpoint high-probability trading setups. This article explores a powerful synergy between two such instruments: the Moving Average Convergence Divergence (MACD) Histogram and price action divergence. This pairing can unveil opportunities for spot trading, offering insights into potential trend reversals and continuations.
Understanding the MACD Histogram
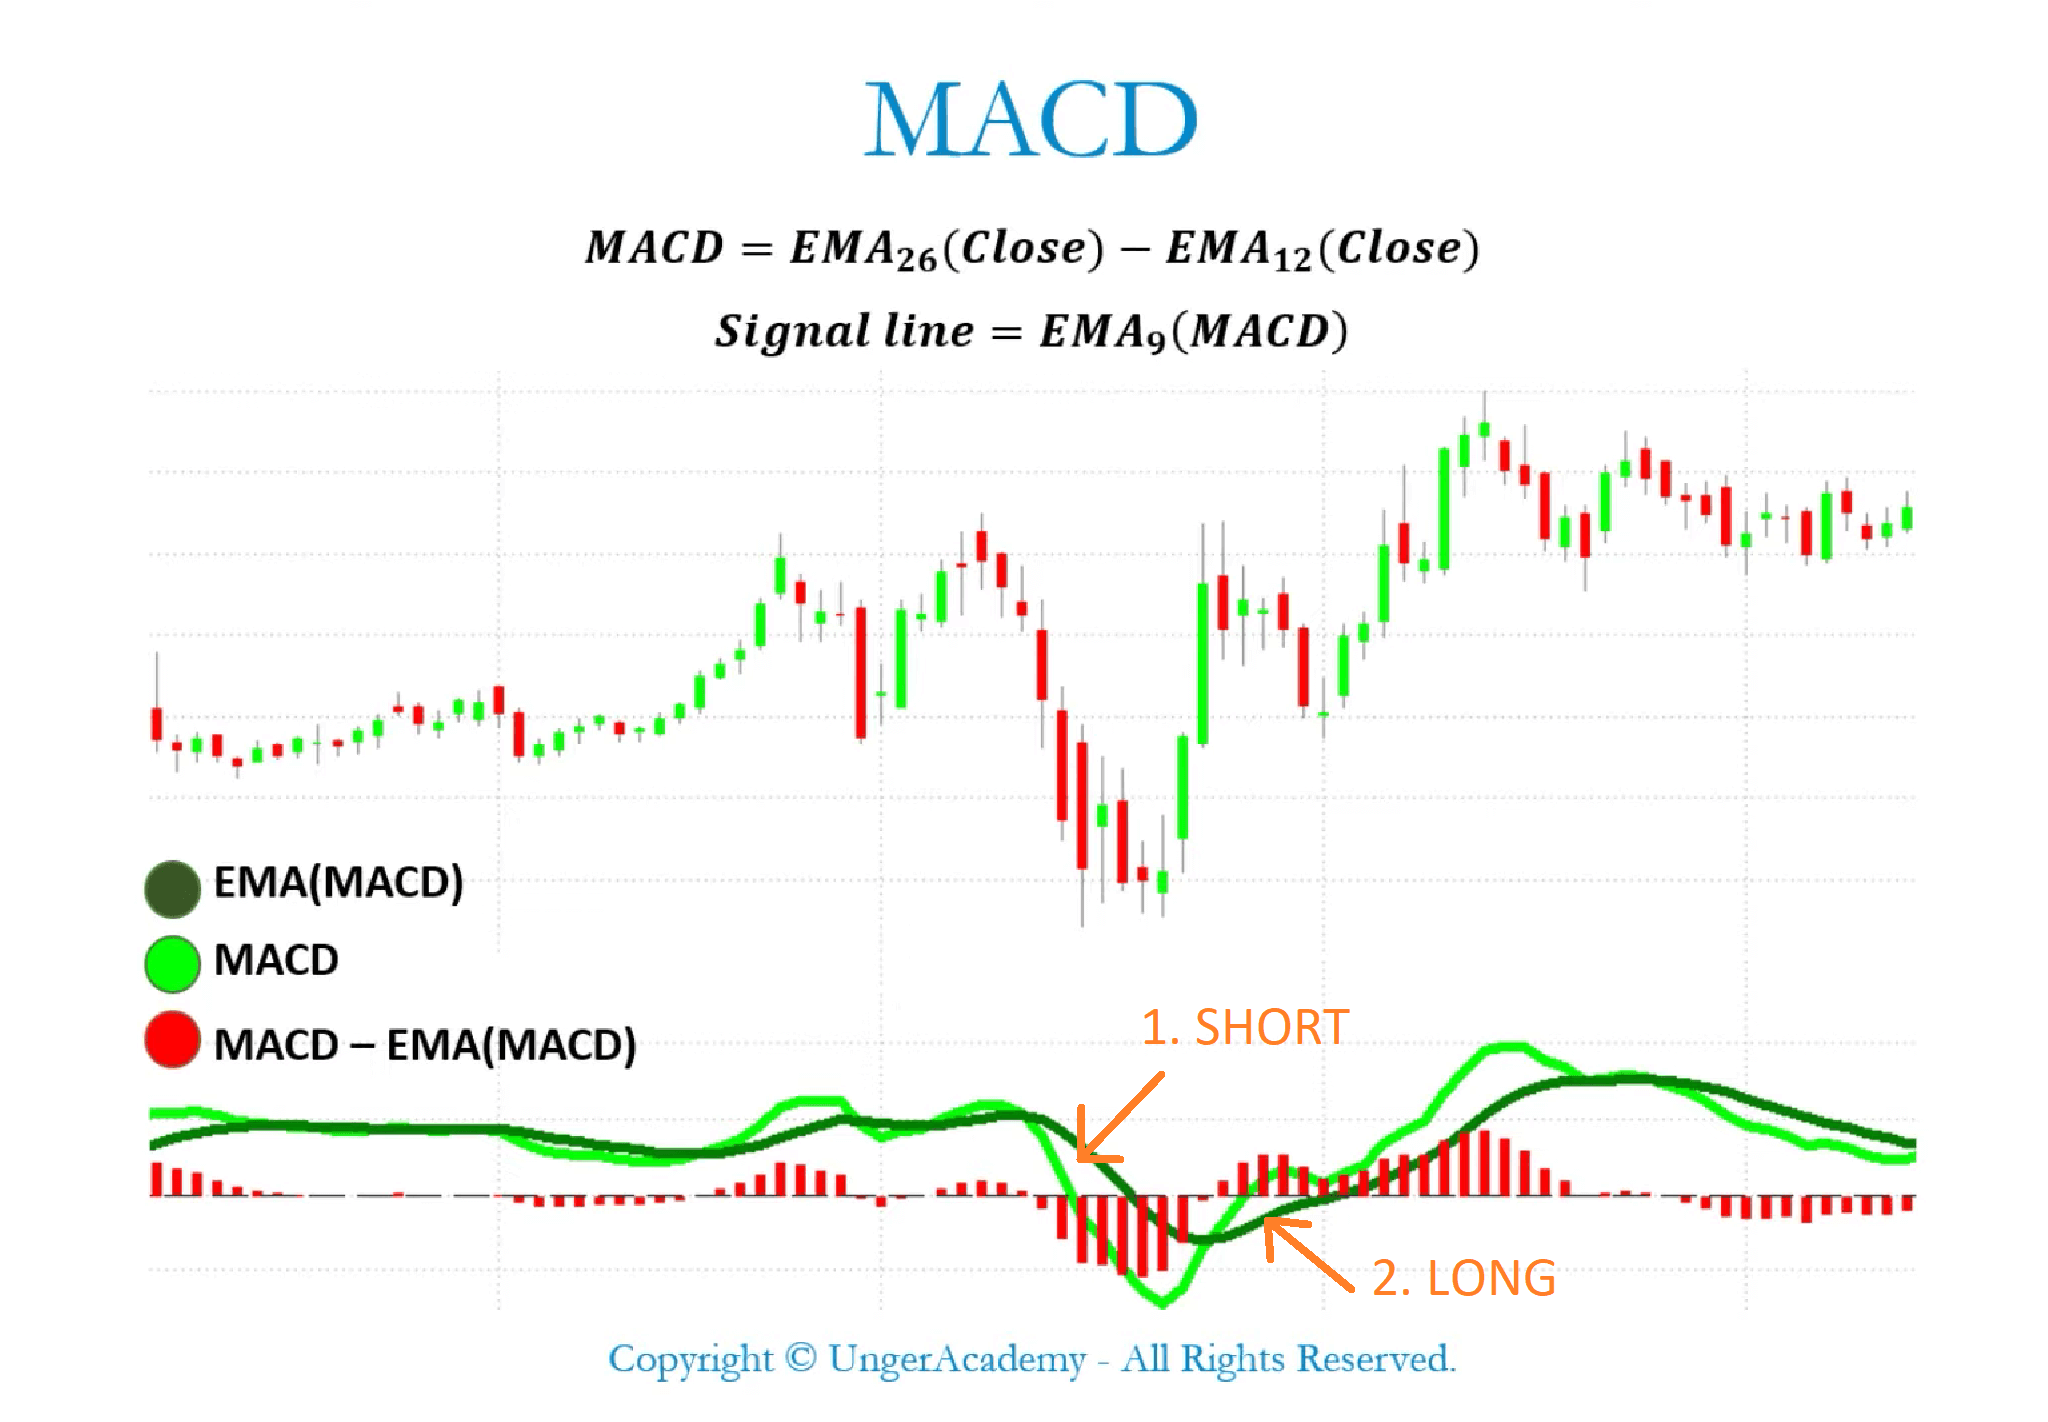
The MACD is a momentum indicator that shows the relationship between two moving averages of a security’s price. The MACD line is calculated by subtracting the 26-period Exponential Moving Average (EMA) from the 12-period EMA. A nine-period EMA of the MACD, called the signal line, is then plotted on top of the MACD line, functioning as a trigger for buy and sell signals.
The MACD Histogram, however, offers a more granular view. It represents the difference between the MACD line and the signal line. This histogram oscillates above and below a zero line, providing visual cues about the momentum and strength of a trend. When the histogram is above zero, it indicates that the MACD line is above the signal line, suggesting upward momentum. Conversely, when the histogram is below zero, the MACD line is below the signal line, indicating downward momentum. The height of the bars in the histogram represents the degree of divergence between the MACD and the signal line, with taller bars signifying greater momentum.
Decoding Divergence in Trading Indicators
Divergence occurs when the price of an asset moves in the opposite direction from a technical indicator. It can signal a potential weakening of the current trend and a possible trend reversal. There are two primary types of divergence:
- Regular Divergence: This type occurs when the price makes a higher high (in an uptrend) or a lower low (in a downtrend), while the indicator makes a lower high or a higher low, respectively. Regular divergence suggests a potential trend reversal.
- Hidden Divergence: Hidden divergence occurs when the price makes a lower high (in an uptrend) or a higher low (in a downtrend), while the indicator makes a higher high or a lower low, respectively. Hidden divergence often indicates a continuation of the current trend.
Understanding these concepts is critical for using the MACD Histogram effectively in identifying trading opportunities.
The Power of MACD Histogram Divergence
Combining the MACD Histogram with divergence analysis provides a powerful way to anticipate potential price movements. Specifically, the MACD Histogram can highlight divergence more clearly than the standard MACD line, as it offers a visual representation of the momentum differences.
Here's how the combination works:
- Identifying Regular Bullish Divergence: The price makes a lower low, while the MACD Histogram makes a higher low. This signals a potential bullish reversal, suggesting the downtrend might be losing momentum and an upward move is likely.
- Identifying Regular Bearish Divergence: The price makes a higher high, while the MACD Histogram makes a lower high. This signals a potential bearish reversal, suggesting the uptrend might be losing momentum and a downward move is likely.
- Identifying Hidden Bullish Divergence: The price makes a higher low, while the MACD Histogram makes a lower low. This suggests a continuation of the existing uptrend.
- Identifying Hidden Bearish Divergence: The price makes a lower high, while the MACD Histogram makes a higher high. This suggests a continuation of the existing downtrend.
The MACD Histogram allows for earlier identification of these divergences, potentially providing a trader with a better entry point.
Setting Up the Chart for MACD Histogram Divergence
To effectively utilize this strategy, the trading platform needs to be configured correctly. Most platforms offer the MACD Histogram as a standard indicator. Here's how to add it:
- Open the trading platform.
- Select the desired financial instrument (e.g., a specific stock, forex pair, or cryptocurrency).
- Add the MACD indicator to the chart. Ensure the settings display the histogram component. The typical settings are 12 for the fast EMA, 26 for the slow EMA, and 9 for the signal EMA.
- Adjust the chart timeframe according to the trading style. Shorter timeframes (e.g., 5-minute, 15-minute) are suitable for scalping, while longer timeframes (e.g., 1-hour, 4-hour, daily) are better for swing trading.
Once the chart is set up, the focus shifts to identifying potential divergence signals.
Spotting Trading Opportunities: Entry and Exit Strategies
Identifying divergence is only the first step. A robust trading strategy requires clear entry and exit rules, along with appropriate risk management. Here's a structured approach:
Entry Rules:
- Regular Bullish Divergence: Enter a long position after the price closes above a recent swing high, confirming the reversal. Alternatively, wait for a candlestick pattern confirmation, such as a bullish engulfing or a hammer.
- Regular Bearish Divergence: Enter a short position after the price closes below a recent swing low, confirming the reversal. Alternatively, wait for a candlestick pattern confirmation, such as a bearish engulfing or a shooting star.
- Hidden Bullish Divergence: Enter a long position after the price breaks above a minor resistance level, confirming the continuation of the uptrend.
- Hidden Bearish Divergence: Enter a short position after the price breaks below a minor support level, confirming the continuation of the downtrend.
Exit Rules:
- Stop-Loss Placement: For long positions, place the stop-loss order slightly below the recent swing low or below a key support level. For short positions, place the stop-loss order slightly above the recent swing high or above a key resistance level. This protects the capital in case the divergence signal is false.
- Profit Targets: Set profit targets based on risk-reward ratios. A common approach is to target a 1:2 or 1:3 risk-reward ratio. For example, if the risk (the distance between the entry point and the stop-loss) is $100, the profit target would be $200 or $300. Alternatively, profit targets can be based on previous resistance levels (for long positions) or support levels (for short positions).
Example Scenario:
Imagine a stock in a downtrend makes a new low. However, the MACD Histogram forms a higher low. This is regular bullish divergence. A trader could wait for the price to close above a recent swing high to confirm the reversal. They enter a long position at that point, placing a stop-loss below the swing low. The profit target is set based on a 1:2 risk-reward ratio or at a previous resistance level.
Risk Management Considerations
Effective risk management is paramount in trading. The MACD Histogram divergence strategy is no exception. Here are some key considerations:
- Position Sizing: Never risk more than 1-2% of the trading capital on a single trade. This protects the capital from significant losses.
- Confirmation Signals: Do not rely solely on divergence signals. Look for additional confirmations, such as candlestick patterns, volume surges, or other technical indicators.
- Market Con Consider the overall market context. Is the market in a strong uptrend or downtrend? Is there any major news or economic event that could affect the price?
- Timeframe Consistency: Ensure the timeframe used for identifying divergence aligns with the trading style. Scalpers should use shorter timeframes, while swing traders should use longer timeframes.
- Backtesting: Before implementing the strategy with real money, backtest it on historical data to evaluate its performance. This helps understand its strengths and weaknesses.
Enhancing the Strategy with Other Trading Indicators
While the MACD Histogram divergence strategy is powerful on its own, it can be further enhanced by combining it with other technical indicators. Here are a few examples:
- Volume: Confirm divergence signals with volume analysis. An increase in volume during a potential reversal can add more weight to the signal. For example, during bullish divergence, a surge in buying volume can confirm the potential upward move.
- Moving Averages: Use moving averages to identify the overall trend. Trade divergence signals that align with the prevailing trend for higher probability setups. For instance, in an uptrend, focus on hidden bullish divergence signals.
- Relative Strength Index (RSI): The RSI can help identify overbought and oversold conditions. Combine RSI with MACD Histogram divergence to refine entry and exit points. For example, enter a long position during bullish divergence when the RSI is below 30 (oversold).
- Fibonacci Levels: Use Fibonacci retracement levels to identify potential support and resistance areas. Align profit targets with Fibonacci levels for more strategic exit points.
Avoiding Common Pitfalls
Even with a well-defined strategy, certain pitfalls can lead to losses. Here are some common mistakes to avoid:
- Ignoring the Overall Trend: Trading against the overall trend can be risky. Focus on divergence signals that align with the prevailing trend for higher probability setups.
- Overtrading: Do not force trades. Only take trades when clear divergence signals are present and confirmed by other indicators.
- Emotional Trading: Avoid making impulsive decisions based on fear or greed. Stick to the trading plan and manage risk effectively.
- Ignoring Economic News: Major economic news events can cause significant price volatility. Avoid trading during these events or adjust the risk management accordingly.
- Lack of Patience: Wait for confirmation signals before entering a trade. Do not jump into a trade prematurely based on a potential divergence signal.
Adapting the Strategy to Different Markets
The MACD Histogram divergence strategy can be adapted to various financial markets, including stocks, forex, and cryptocurrencies. However, it's important to understand the characteristics of each market and adjust the strategy accordingly.
- Stocks: Stocks tend to be more influenced by company-specific news and earnings reports. Consider these factors when trading stock divergence signals.
- Forex: Forex markets are highly liquid and volatile. Use tighter stop-loss orders and be aware of economic news releases.
- Cryptocurrencies: Cryptocurrency markets are known for their extreme volatility. Use smaller position sizes and be prepared for rapid price swings.
Advanced Techniques: Combining Divergence with Harmonic Patterns
For advanced traders, the MACD Histogram divergence strategy can be combined with harmonic patterns to identify high-probability trading setups. Harmonic patterns are geometric price structures that can predict potential price reversals. Common harmonic patterns include the Gartley, Butterfly, Bat, and Crab patterns.
Here's how to combine divergence with harmonic patterns:
- Identify a potential harmonic pattern forming on the chart.
- Look for divergence between the price and the MACD Histogram at key points within the harmonic pattern.
- Confirm the potential reversal with candlestick patterns or other technical indicators.
- Enter a trade at the completion of the harmonic pattern, with a stop-loss order placed according to the pattern's rules.
- Set profit targets based on Fibonacci retracement levels or other harmonic pattern targets.
Combining divergence with harmonic patterns can significantly improve the accuracy and profitability of the trading strategy.
Conclusion
The combination of the MACD Histogram and divergence analysis offers a valuable tool for traders seeking to identify potential trend reversals and continuations. By understanding the principles of divergence, setting up the chart correctly, implementing clear entry and exit rules, and managing risk effectively, traders can improve their chances of success. This strategy is particularly effective during periods of market consolidation, where price movements become less predictable. However, like any trading strategy, it requires practice, patience, and discipline. It is highly recommended to test and refine this strategy using a demo account before risking real capital. This allows traders to familiarize themselves with the nuances of the strategy and develop a solid understanding of its strengths and weaknesses. Remember to always adapt the strategy to the specific market conditions and individual trading style. Further research into other related trading indicators can also enhance comprehension and refine trading decisions.
🤖 AI-Powered Trading Indicators
Win Up To 93% of Trades With the #1 Most Profitable Indicators
Unlock the power of artificial intelligence and take your trading to the next level. Our VIP Trading Indicators are designed to help you dominate any market — Forex, Crypto, Stocks — with up to 93% accuracy.
Gain instant 24/7 access to 5+ powerful, battle-tested indicators built to predict market trends with precision. Whether you're a beginner or an expert, these tools are optimized for all skill levels and work on any device.
✓ 30-Day Money Back Guarantee — Try Risk-Free!