
In the multifaceted realm of financial speculation, many strategies revolve around the utilization of indicator-based systems to pinpoint potential entry and exit points. While individual tools can provide valuable insights, combining several often yields a more robust and reliable trading approach. This article explores the synergistic relationship between the Relative Strength Index (RSI) and Bollinger Bands, focusing on how their combined signals can enhance trade precision. The core strategy involves identifying periods of volatility contraction signaled by a Bollinger Band "squeeze," coupled with confirmation from the RSI to validate the direction and strength of the anticipated breakout.
Understanding the Tools
Before diving into the specifics of the combined strategy, a foundational understanding of each component is necessary. The article offers a quick recap on each indicator, setting the stage for illustrating their utility in a trading context.
Quick Refresher: What is RSI?
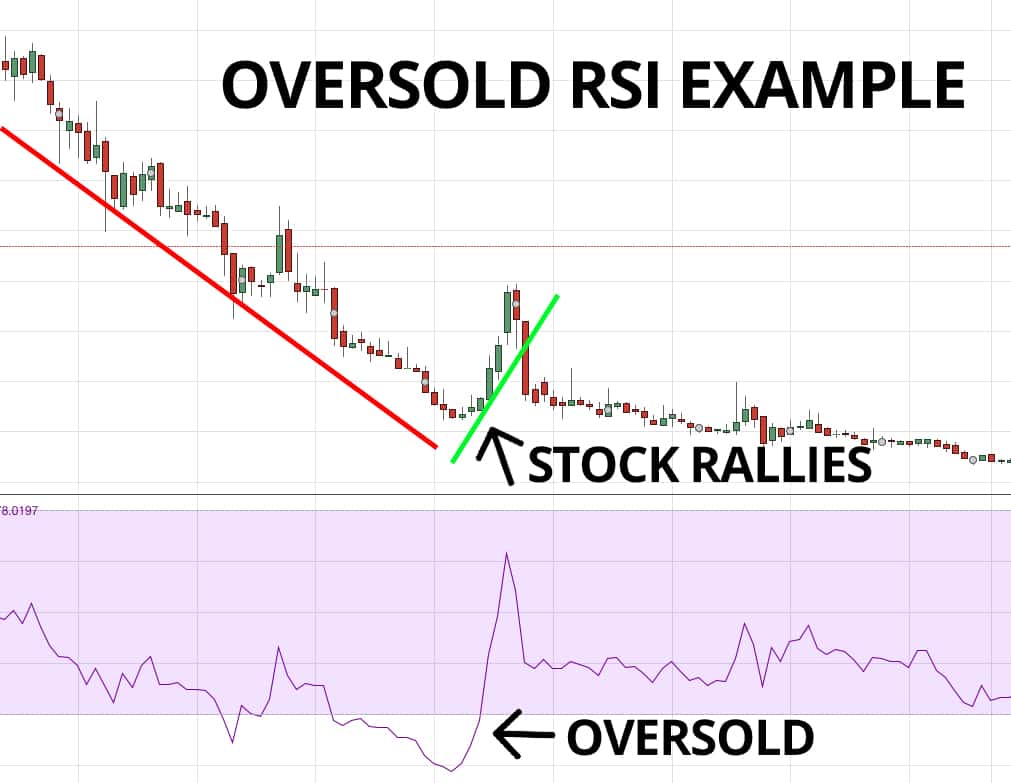
The Relative Strength Index (RSI) is a momentum oscillator that measures the magnitude of recent price changes to evaluate overbought or oversold conditions in the price of a stock or other asset. It is primarily used to identify price trends and potential reversal points. The RSI is displayed as an oscillator with a value ranging from 0 to 100. Conventionally, an RSI reading of 70 or above indicates that an asset is becoming overbought and may be poised for a trend reversal or corrective pullback. Conversely, an RSI reading of 30 or below suggests that an asset is oversold and could be due for a rally. The RSI can also be used to identify divergences, which occur when the price of an asset is making new highs or lows, but the RSI is not confirming those moves. These divergences can be early warning signs of potential trend reversals.
How Bollinger Bands Work and What a "Squeeze" Means
Bollinger Bands are a type of technical indicator developed by John Bollinger. They consist of three lines: a simple moving average (SMA), an upper band, and a lower band. The upper and lower bands are typically calculated as two standard deviations away from the SMA. These bands dynamically adjust to price volatility; widening when volatility increases and narrowing when volatility decreases. A "squeeze" occurs when the Bollinger Bands constrict, meaning the upper and lower bands move closer together, signifying a period of low volatility. This is considered a precursor to a potential breakout, as periods of low volatility are often followed by periods of high volatility. The direction of the breakout is not predetermined by the squeeze itself and needs confirmation from other indicators or price action analysis.
Why Volatility Contraction Precedes Expansion
The principle that volatility contraction often precedes expansion is rooted in market dynamics. Markets tend to cycle between periods of consolidation and trending. During consolidation, participants are often indecisive, leading to sideways price movement and reduced volatility. This phase can be characterized by indecision and a balance between buying and selling pressure. However, this equilibrium cannot last indefinitely. Eventually, a catalyst, such as news events, earnings reports, or shifts in market sentiment, will tip the balance, triggering a surge in buying or selling pressure. As participants react to the catalyst, prices begin to move more decisively, leading to increased volatility. The longer the period of consolidation, the greater the potential for a significant breakout, as pent-up energy is released once a clear direction emerges. This makes the Bollinger Band squeeze a valuable tool for identifying potential opportunities in a market poised for a change in volatility.
Identifying the Setup
Identifying the right setup is crucial for the success of any trading strategy. This section provides the conditions for a valid squeeze, the RSI transitions, and a chart example of the setup.
Conditions for a Valid Squeeze
For a Bollinger Band squeeze to be considered valid, several conditions should be met. First, the bandwidth, which is the difference between the upper and lower bands, should be at its lowest level compared to a recent period (typically 6 months). The narrower the bands, the more significant the squeeze. Second, the price action should be relatively flat or sideways during the squeeze period, indicating a lack of a clear trend. Third, the moving average used to calculate the bands should be relatively stable. If the moving average is trending strongly, the squeeze may be less reliable. It's important to note that a squeeze does not guarantee a breakout in either direction. It simply indicates a period of low volatility that is likely to be followed by a period of high volatility. Therefore, additional confirmation is needed to determine the likely direction of the breakout.
RSI in Neutral → Overbought/Oversold Transition
The transition of the RSI from a neutral zone (around 50) to overbought (above 70) or oversold (below 30) territory can provide valuable confirmation for a potential breakout following a Bollinger Band squeeze. When the RSI moves from neutral to overbought after a squeeze, it suggests that the breakout is likely to be upward. Conversely, when the RSI moves from neutral to oversold, it suggests that the breakout is likely to be downward. However, it's essential to consider the broader context of the market and any potential divergences between the RSI and price action. For example, if the RSI is moving into overbought territory but the price is not making new highs, this could be a bearish divergence, suggesting that the upward breakout may be short-lived. Similarly, if the RSI is moving into oversold territory but the price is not making new lows, this could be a bullish divergence, suggesting that the downward breakout may be unsustainable. The RSI should be used in conjunction with other trading indicators and price action analysis to improve the accuracy of trading signals.
Chart Example of Squeeze + RSI Divergence
Consider a hypothetical stock trading within a defined range for several weeks. During this period, the Bollinger Bands begin to narrow, indicating a squeeze. Simultaneously, the RSI hovers around the 50 level, suggesting a neutral momentum. As the price approaches the upper band, the RSI starts to climb above 70, signaling an overbought condition. However, instead of confirming the upward price movement, the RSI forms a lower high compared to its previous peak, creating a bearish divergence. This divergence suggests that despite the overbought RSI, the upward momentum is weakening, and a potential downward reversal is likely. Traders might interpret this setup as a shorting opportunity, anticipating a break below the lower Bollinger Band. Conversely, if the RSI had moved below 30 and formed a bullish divergence, it would suggest a possible long position upon a break above the upper band. Examining such chart examples helps traders better understand the interplay between the Bollinger Band squeeze and RSI divergences, enabling more informed decisions.
Entry & Exit Rules
Establishing clear entry and exit rules is paramount for effective strategy implementation and risk management. This section will explore the specific rules around entering, stopping out, and taking profits.
Entry When Price Breaks Upper/Lower Bollinger Band with RSI Confirmation
The primary entry signal for this strategy is triggered when the price breaks above the upper Bollinger Band or below the lower Bollinger Band, confirming the anticipated breakout from the squeeze. However, this breakout must be validated by the RSI. For a long entry (break above the upper band), the RSI should ideally be trending upwards and above the 50 level, indicating positive momentum. A strong RSI reading above 60 would further strengthen the signal. Conversely, for a short entry (break below the lower band), the RSI should be trending downwards and below the 50 level, signaling negative momentum. An RSI reading below 40 would reinforce the short signal. The break of the Bollinger Band should occur on above-average volume to confirm the increased participation and conviction behind the move. A candlestick pattern that confirms the breakout, such as a bullish engulfing pattern for a long entry or a bearish engulfing pattern for a short entry, can provide additional confirmation.
Setting Stop-Loss Below Squeeze Base
Proper stop-loss placement is essential for managing risk. A conservative approach is to set the stop-loss order just below the base of the squeeze for long positions, and just above the base of the squeeze for short positions. The "base of the squeeze" refers to the lowest low within the squeeze range for long positions, and the highest high within the squeeze range for short positions. This placement aims to protect the trade from false breakouts or short-term retracements. It is advisable to add a small buffer to the stop-loss level to account for market noise and prevent premature triggering. The buffer size can be based on the asset's average true range (ATR) or recent volatility. For example, a buffer of 0.5 to 1 times the ATR could be added to the stop-loss level. Traders may also consider using a more dynamic approach, such as a trailing stop-loss, which adjusts as the price moves in their favor, locking in profits and reducing risk.
Profit Targets Based on ATR or Recent Swing Highs/Lows
Defining profit targets before entering a trade is crucial for maximizing potential gains and maintaining a disciplined approach. One common method is to set profit targets based on the Average True Range (ATR). For instance, a trader might set a profit target of 1.5 to 2 times the ATR from the entry point. This approach adjusts to the asset's volatility, providing a more realistic profit expectation. Another approach is to identify recent swing highs (for long positions) or swing lows (for short positions) and use them as potential profit targets. Swing highs and lows represent areas of potential resistance or support, and the price is likely to encounter selling or buying pressure at these levels. Traders may also consider using Fibonacci extensions to identify potential resistance or support levels beyond the recent swing highs or lows. Regardless of the method used, it is essential to regularly reassess the profit targets based on changing market conditions and the asset's price action. It is often prudent to partially close the position at the initial profit target and move the stop-loss order to breakeven, allowing the remaining portion of the position to run further, potentially capturing additional profits.
Risk Management Tips
Successful implementatio of a strategy relies heavily on adhering to prudent risk management practices. The following provides techniques to minimize exposure while maximizing trading outcomes.
Filtering Signals with Volume or Candlestick Confirmation
To enhance the reliability of signals generated by the combined Bollinger Band squeeze and RSI strategy, it is beneficial to incorporate volume and candlestick analysis. A breakout from the squeeze accompanied by a surge in volume suggests strong participation and conviction behind the move. This confirms that the breakout is not just a false signal but rather a genuine shift in market sentiment. For instance, a break above the upper Bollinger Band should ideally be accompanied by a significant increase in buying volume, indicating that buyers are actively pushing the price higher. Conversely, a break below the lower Bollinger Band should be accompanied by a surge in selling volume, indicating strong selling pressure. Candlestick patterns can also provide valuable confirmation. Bullish candlestick patterns, such as bullish engulfing, piercing patterns, or morning stars, can confirm a potential upward breakout. Bearish candlestick patterns, such as bearish engulfing, dark cloud cover, or evening stars, can confirm a potential downward breakout. Filtering signals with volume and candlestick confirmation helps traders avoid false breakouts and improve the overall accuracy of the trading strategy.
Backtesting the Strategy Over Multiple Timeframes
Before deploying any trading strategy with real capital, it is crucial to thoroughly backtest it over a range of historical data and across multiple timeframes. Backtesting involves simulating trades based on the strategy's rules and analyzing the results to assess its profitability, win rate, drawdown, and other key performance metrics. By backtesting the combined Bollinger Band squeeze and RSI strategy on different timeframes, traders can gain insights into its effectiveness under various market conditions and identify the optimal timeframe for trading the strategy. For example, the strategy may perform well on a 1-hour timeframe but may not be as effective on a 15-minute timeframe or a daily timeframe. Backtesting can also help traders fine-tune the strategy's parameters, such as the Bollinger Band standard deviation multiplier, the RSI overbought/oversold levels, and the stop-loss and profit target placements, to maximize its performance. It is essential to use a robust backtesting platform that allows for realistic simulations and accounts for factors such as slippage and commissions. The more extensive and thorough the backtesting process, the more confidence traders can have in the strategy's potential and its ability to generate consistent profits.
Avoiding False Breakouts During News Events
News events can significantly impact market volatility and price action, often leading to false breakouts that can trigger stop-loss orders and result in losses. To mitigate the risk of being caught in false breakouts during news events, it is advisable to avoid trading the combined Bollinger Band squeeze and RSI strategy during periods of high-impact economic announcements or geopolitical events. Traders should be aware of the economic calendar and identify upcoming news events that could potentially affect the assets they are trading. It is generally prudent to close any open positions before a major news announcement or wait until the market has digested the news and established a clear direction. Alternatively, traders may choose to reduce their position size or widen their stop-loss orders to account for the increased volatility. Another approach is to use options strategies, such as straddles or strangles, to profit from the anticipated volatility without taking a directional bias. By avoiding trading during news events or implementing appropriate risk management measures, traders can protect their capital and improve their overall trading performance.
Conclusion
The combined implementation of RSI and Bollinger Band squeeze strategies can result in effective trading opportunities. The ability to identify periods of low volatility using Bollinger Bands, coupled with the momentum confirmation provided by the RSI, offers a framework for capitalizing on impending breakouts. This fusion of tools allows for a more nuanced and precise assessment of potential entry points. It's essential to remember that no strategy guarantees profits, and risk management is paramount. The combination of tools may prove particularly effective during market consolidation phases, where volatility is low, and the market is poised for a significant move.
Ultimately, proficiency with this strategy, or any other, requires practice and refinement. Before deploying real capital, it is strongly advised to rigorously test the strategy on a demo account to develop a deep understanding of its nuances and limitations. This hands-on experience will allow you to adapt the strategy to your individual trading style and risk tolerance.
Begin your journey towards more informed speculation by familiarizing yourself with the synergy of RSI and Bollinger Bands, enhancing your ability to discern valuable trading opportunities.
🤖 AI-Powered Trading Indicators
Win Up To 93% of Trades With the #1 Most Profitable Indicators
Unlock the power of artificial intelligence and take your trading to the next level. Our VIP Trading Indicators are designed to help you dominate any market — Forex, Crypto, Stocks — with up to 93% accuracy.
Gain instant 24/7 access to 5+ powerful, battle-tested indicators built to predict market trends with precision. Whether you're a beginner or an expert, these tools are optimized for all skill levels and work on any device.
✓ 30-Day Money Back Guarantee — Try Risk-Free!