
Employing trading indicators is a common method utilized by those active in the financial markets to analyze price movements and potentially forecast future trends. A strategy that combines the Heiken Ashi charting technique with Bollinger Bands presents an intriguing approach for identifying possible trading opportunities. This article will explore the intricacies of this approach, dissecting each component and outlining how they can be integrated into a cohesive trading plan.
Understanding the Tools
Quick Refresher: What is Heiken Ashi?
Heiken Ashi, meaning "average pace" in Japanese, is a type of charting technique used to visualize price data. Unlike traditional candlestick charts which plot prices directly, Heiken Ashi calculates the average price movement, smoothing out the price action and potentially revealing clearer trends. This smoothing effect helps to filter out noise and can make it easier to identify sustained price direction.
The formulas for calculating Heiken Ashi candlesticks are:
- Close: (Open + High + Low + Close)/4
- Open: (Open of previous bar + Close of previous bar)/2
- High: Maximum of High, Open, or Close (current period)
- Low: Minimum of Low, Open, or Close (current period)
These calculations result in candlesticks that paint a smoother picture of price movement, making trend identification potentially simpler.
How Bollinger Bands Work and What a "Squeeze" Means
Bollinger Bands are a technical analysis tool defined by a set of lines plotted two standard deviations away from a simple moving average (SMA). These bands dynamically adjust to volatility, widening during periods of high volatility and contracting during periods of low volatility. The default settings typically use a 20-period SMA and two standard deviations.
A "squeeze" occurs when the Bollinger Bands contract, indicating a period of low volatility. This contraction suggests that the market is consolidating, and a significant price move is likely to follow. The underlying principle is that periods of low volatility are often followed by periods of high volatility.
Why Volatility Contraction Precedes Expansion
The concept of volatility contraction preceding expansion is based on the inherent nature of market cycles. Markets tend to oscillate between periods of stability (low volatility) and periods of instability (high volatility). A prolonged period of sideways movement or consolidation leads to a build-up of potential energy. This energy eventually releases, causing a breakout or breakdown, resulting in a significant price movement. Bollinger Bands help to visually identify these periods of low volatility, signaling a potential impending expansion.
Identifying the Setup
Conditions for a Valid Squeeze
To identify a valid Bollinger Band squeeze, look for a noticeable narrowing of the bands. The upper and lower bands should be visibly closer to the moving average than usual, indicating decreased price volatility. It's crucial to visually confirm that the bands have been contracting for a sustained period before considering it a valid squeeze. There is no set number of periods for a squeeze, it is more about judging the visual pattern of narrowing bands.
Heiken Ashi and Bollinger Band Squeeze Confluence
Heiken Ashi charts can filter some of the noise of candlestick charts. When the Bollinger Bands are in a squeeze, it is worth checking the direction in the Heiken Ashi charts. If Heiken Ashi charts are indecisive or showing signs of changing direction (e.g., from bearish to bullish), this could add confidence to the signals from the squeeze.
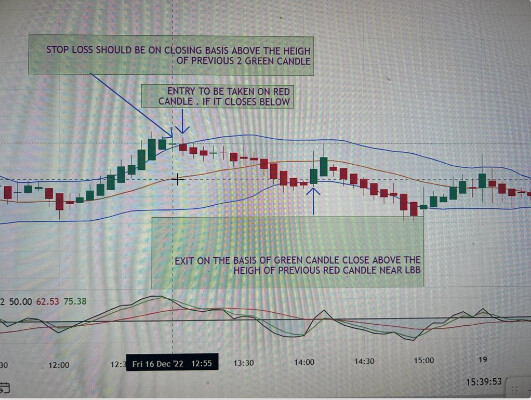
Chart Example of Squeeze
Imagine a chart of a stock trading sideways for several weeks. The Bollinger Bands have been steadily narrowing, reflecting the low volatility environment. Suddenly, news breaks about the company, creating the potential for a larger move. The bands, now tightly compressed, await a trigger. The confluence of a squeeze, the change in Heiken Ashi candlesticks, and a catalyst like news creates a potential trading setup.
Entry & Exit Rules
Entry When Price Breaks Upper/Lower Bollinger Band
The entry signal is triggered when the price breaks above the upper Bollinger Band or below the lower Bollinger Band. This breakout indicates that the period of consolidation is ending, and the price is initiating a move in a specific direction. Some traders prefer to wait for a candlestick to close beyond the band to confirm the breakout's validity. Another approach is to look for increased volume on the breakout, which may lend more support to the move.
Setting Stop-Loss Below Squeeze Base
A key aspect of any trading strategy is setting a stop-loss order. In this strategy, a sensible place for the stop-loss is below the base of the squeeze (for a long position) or above the base of the squeeze (for a short position). This placement aims to protect capital if the breakout turns out to be a false signal and the price reverses back into the consolidation range. The exact distance of the stop-loss from the squeeze base depends on individual risk tolerance and the volatility of the asset being traded.
Profit Targets Based on ATR or Recent Swing Highs/Lows
Determining profit targets is crucial for locking in gains. One approach is to use the Average True Range (ATR) to project potential price movement. For instance, a trader could set a profit target equal to two or three times the ATR from the entry point. Another method is to identify recent swing highs (for long positions) or swing lows (for short positions) and use them as potential profit target levels. These levels often act as areas of resistance or support, respectively.
Risk Management Tips
Filtering Signals with Volume
Volume often precedes price. High volume often accompanies the breakout of a squeeze, validating the move and increasing the likelihood of continuation. Conversely, a breakout on low volume might be a false signal, indicating a lack of conviction from market participants. A simple volume confirmation is to look for above-average volume during the breakout. Comparing volume to its moving average is a common practice.
Backtesting the Strategy Over Multiple Timeframes
Backtesting is the process of applying a trading strategy to historical data to assess its performance. It's essential to backtest the strategy over various timeframes to understand its effectiveness under different market conditions. What works well on a 15-minute chart might not be as effective on a daily chart. Backtesting helps to refine the strategy's parameters and identify its strengths and weaknesses.
Avoiding False Breakouts During News Events
News events can trigger significant price volatility, leading to false breakouts. During periods of high-impact news releases, the market can react erratically, causing prices to spike above or below Bollinger Bands only to reverse shortly afterward. It's prudent to avoid trading this strategy during such events or to reduce position sizes significantly to mitigate the risk of getting caught in a false breakout.
Conclusion
The combination of Heiken Ashi and Bollinger Bands presents a systematic approach to identifying and trading potential breakouts. The Heiken Ashi smooths out price action, which helps to identify trends while the Bollinger Band squeeze identifies periods of low volatility, signaling potential future price expansion. By combining these two tools, traders can potentially identify high-probability trading setups and manage risk effectively. However, it's crucial to remember that no strategy is foolproof, and proper risk management techniques are essential for long-term success.
This strategy may be particularly effective during periods of market consolidation, where prices are trading within a defined range and volatility is low. It provides a framework for anticipating breakouts and capitalizing on the subsequent price movements.
Before implementing this strategy with real capital, it is highly recommended to thoroughly test it using a demo account. This allows for familiarization with the strategy's nuances and refine the trading parameters without risking actual funds. Consistent practice and disciplined risk management are paramount to maximizing the potential benefits of this approach.
The concepts explored within this strategy are based on the foundation of established "Trading Indicators". The integration of these elements is a key factor for any potential trader.
🤖 AI-Powered Trading Indicators
Win Up To 93% of Trades With the #1 Most Profitable Indicators
Unlock the power of artificial intelligence and take your trading to the next level. Our VIP Trading Indicators are designed to help you dominate any market — Forex, Crypto, Stocks — with up to 93% accuracy.
Gain instant 24/7 access to 5+ powerful, battle-tested indicators built to predict market trends with precision. Whether you're a beginner or an expert, these tools are optimized for all skill levels and work on any device.
✓ 30-Day Money Back Guarantee — Try Risk-Free!