
Navigating the financial markets demands a robust toolkit, and indicator-based strategies have become a cornerstone for many traders. These strategies offer a systematic approach to analyzing price movements, identifying potential trends, and making informed decisions. The efficacy of any indicator can be significantly enhanced when used in conjunction with others, allowing for confirmation of signals and a more comprehensive view of market dynamics. This exploration delves into the synergistic relationship between two powerful indicators: the Ichimoku Cloud and the Chikou Span, showcasing how their combined use can potentially improve trading outcomes. By understanding the individual strengths of each and how they complement one another, traders can potentially unlock a more refined and effective approach to market analysis.
Understanding the Ichimoku Cloud
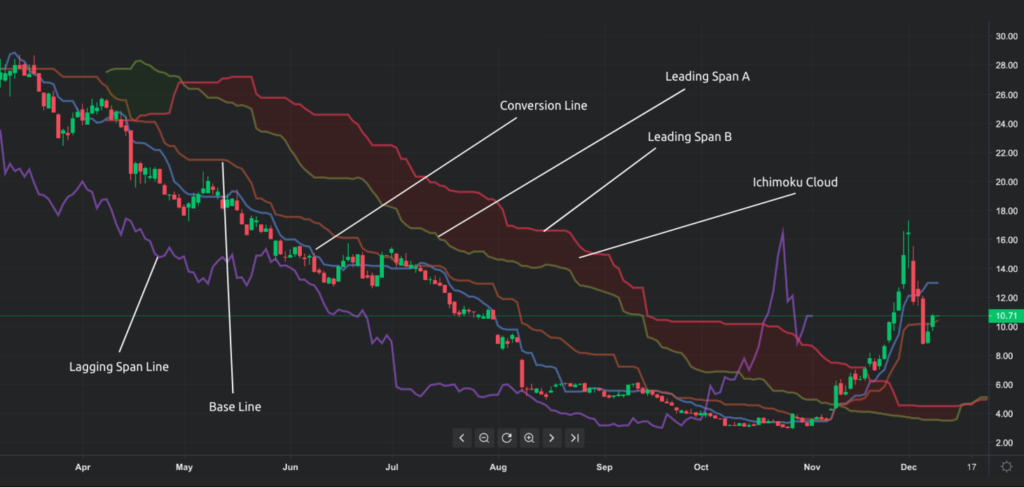
The Ichimoku Cloud, also known as Ichimoku Kinko Hyo, is a versatile technical indicator that defines support and resistance, identifies trend direction, gauges momentum, and provides trading signals. Unlike many singular indicators, the Ichimoku Cloud is a comprehensive system composed of five different lines:
- Tenkan-sen (Conversion Line): Calculated as the average of the highest high and the lowest low over the past nine periods. It serves as an indicator of short-term price movement.
- Kijun-sen (Base Line): Calculated as the average of the highest high and the lowest low over the past 26 periods. It represents a more medium-term trend.
- Senkou Span A (Leading Span A): Calculated as the average of the Tenkan-sen and Kijun-sen, plotted 26 periods into the future. It forms one boundary of the Ichimoku Cloud.
- Senkou Span B (Leading Span B): Calculated as the average of the highest high and the lowest low over the past 52 periods, plotted 26 periods into the future. It forms the other boundary of the Ichimoku Cloud.
- Chikou Span (Lagging Span): Represents the closing price plotted 26 periods in the past.
The area between Senkou Span A and Senkou Span B is what forms the cloud.If the price is above the cloud, the trend is generally considered to be bullish; if the price is below the cloud, the trend is generally considered to be bearish. The cloud itself acts as dynamic support and resistance.
The Role of the Chikou Span
The Chikou Span is a crucial component of the Ichimoku Cloud. Its unique function is to provide a perspective on the relationship between the current price and past price action. By plotting the current closing price 26 periods in the past, the Chikou Span offers insights into potential support and resistance levels and can act as a confirmation tool for other signals generated by the Ichimoku Cloud.
When the Chikou Span is above the price from 26 periods ago, it suggests bullish momentum. Conversely, if the Chikou Span is below the price from 26 periods ago, it indicates bearish momentum. Crossovers of the Chikou Span with the price can be interpreted as potential buy or sell signals, respectively. However, relying solely on these crossovers can lead to false signals. Therefore, integrating the Chikou Span with the other elements of the Ichimoku Cloud enhances its reliability.
Combining the Ichimoku Cloud and Chikou Span for Enhanced Trading
The true power of the Ichimoku Cloud lies in its ability to be interpreted holistically. While individual components provide valuable information, their combined analysis offers a more robust and reliable trading strategy. The Chikou Span plays a vital role in confirming signals generated by the other components, particularly regarding trend direction and potential entry and exit points.
Here's how the Chikou Span can be used in conjunction with the other Ichimoku Cloud components:
- Trend Confirmation: If the price is above the cloud, suggesting a bullish trend, and the Chikou Span is also above the price from 26 periods ago, it provides additional confirmation of the bullish trend. Conversely, if the price is below the cloud and the Chikou Span is below the price from 26 periods ago, it strengthens the bearish signal.
- Support and Resistance: The Chikou Span can identify potential support and resistance levels by highlighting areas where the price has previously reacted. If the Chikou Span is approaching a past price level, it can indicate a potential area of support or resistance for the current price.
- Entry and Exit Signals: A potential buy signal can be generated when the price breaks above the cloud and the Chikou Span is also above the price from 26 periods ago. Similarly, a sell signal can be generated when the price breaks below the cloud and the Chikou Span is below the price from 26 periods ago.
- Filtering False Signals: The Chikou Span can help filter out false signals generated by other Ichimoku Cloud components. For example, if the price breaks above the cloud, but the Chikou Span is still below the price from 26 periods ago, it suggests that the bullish breakout may be weak and should be approached with caution.
Identifying High-Probability Trading Setups with the Chikou Span Filter
To effectively utilize the Chikou Span as a filter, one must understand the conditions that constitute a high-probability setup. These conditions involve the alignment of multiple Ichimoku Cloud components with the Chikou Span's confirmation.
- Cloud Breakout with Chikou Span Confirmation: This is arguably the most common and reliable setup. It occurs when the price breaks out of the Ichimoku Cloud, signaling a potential trend reversal. However, the signal is only considered valid if the Chikou Span is also confirming the breakout by being above (for a bullish breakout) or below (for a bearish breakout) the price from 26 periods ago.
- Chikou Span Breakout of Past Price Levels: If the Chikou Span breaks above a significant past price level, it suggests that the current price is likely to continue moving higher. Conversely, if the Chikou Span breaks below a significant past price level, it indicates a potential decline in the current price.
- Chikou Span Bounce from Cloud Support/Resistance: When the Chikou Span approaches the cloud, it can act as a leading indicator of potential support or resistance for the current price. If the Chikou Span bounces off the cloud, it confirms the validity of the support or resistance level and suggests a continuation of the prevailing trend.
Entry and Exit Rules Incorporating the Chikou Span
Defining clear entry and exit rules is paramount for any successful trading strategy. When incorporating the Chikou Span filter, the following guidelines can be used:
Entry Rules:
- Bullish Entry: Enter a long position when the price breaks above the cloud, the Chikou Span is above the price from 26 periods ago, and other Ichimoku Cloud components support the bullish signal.
- Bearish Entry: Enter a short position when the price breaks below the cloud, the Chikou Span is below the price from 26 periods ago, and other Ichimoku Cloud components support the bearish signal.
- Conservative Entry: Wait for a pullback to the cloud support (in a bullish scenario) or resistance (in a bearish scenario) after the initial breakout and Chikou Span confirmation. This can provide a better entry price and reduce the risk of a false breakout.
Exit Rules:
- Stop-Loss Placement: Place the stop-loss order below the cloud support (in a bullish scenario) or above the cloud resistance (in a bearish scenario). Alternatively, a fixed percentage stop-loss can be used based on the trader's risk tolerance.
- Profit Target: Set a profit target based on a multiple of the risk (e.g., 2:1 or 3:1 risk-reward ratio). Alternatively, use previous swing highs (in a bullish scenario) or swing lows (in a bearish scenario) as potential profit targets.
- Trailing Stop: Implement a trailing stop-loss to lock in profits as the price moves in the desired direction. This can help maximize profits while protecting against potential reversals.
- Chikou Span as an Exit Signal: If the Chikou Span crosses back below the price (in a bullish position) or above the price (in a bearish position), it can be interpreted as a warning sign of a potential trend reversal and a signal to exit the position.
Risk Management Strategies with the Ichimoku Cloud and Chikou Span
Effective risk management is essential for preserving capital and achieving long-term profitability. When trading with the Ichimoku Cloud and Chikou Span, the following risk management strategies can be implemented:
- Position Sizing: Determine the appropriate position size based on risk tolerance and account size. A common rule of thumb is to risk no more than 1-2% of the account balance on any single trade.
- Stop-Loss Orders: Always use stop-loss orders to limit potential losses. The stop-loss order should be placed at a level that invalidates the trading setup.
- Diversification: Diversify the portfolio across different assets and markets to reduce the risk of being overexposed to any single investment.
- Avoid Overtrading: Avoid trading excessively, as this can lead to increased transaction costs and emotional decision-making.
- News Events: Be aware of upcoming news events that could impact the market and avoid trading during periods of high volatility. Economic releases and geopolitical events can cause significant price swings, which can trigger stop-loss orders and result in unexpected losses.
Backtesting and Optimization of the Strategy
Before implementing any trading strategy in live markets, it is crucial to backtest it using historical data. Backtesting allows traders to evaluate the strategy's performance over different market conditions and identify potential weaknesses. The Ichimoku Cloud and Chikou Span strategy can be backtested using various charting software or trading platforms.
During the backtesting process, the following metrics should be analyzed:
- Win Rate: The percentage of winning trades.
- Profit Factor: The ratio of gross profit to gross loss.
- Maximum Drawdown: The largest peak-to-trough decline in the account balance.
- Average Trade Duration: The average length of time that trades are held open.
Based on the backtesting results, the strategy can be optimized by adjusting the entry and exit rules, stop-loss placement, and profit target levels. Optimization should be performed carefully to avoid overfitting the strategy to historical data, which can lead to poor performance in live markets.
Example Trade Scenario
Let's illustrate how the Ichimoku Cloud and Chikou Span can be used in a real-world trading scenario. Assume that a trader is analyzing a daily chart of a stock and observes the following:
- The price has been trading below the Ichimoku Cloud for several months, indicating a bearish trend.
- Recently, the price has broken above the cloud, suggesting a potential trend reversal.
- The Chikou Span is also above the price from 26 periods ago, confirming the bullish breakout.
- The Tenkan-sen is above the Kijun-sen, further supporting the bullish signal.
Based on these observations, the trader decides to enter a long position with a stop-loss order placed below the cloud support and a profit target set at a previous swing high. The trader monitors the price action closely and adjusts the trailing stop-loss as the price moves higher. Eventually, the price reaches the profit target, and the trader closes the position with a profit.
Limitations and Considerations
While the Ichimoku Cloud and Chikou Span can be powerful tools, it is essential to acknowledge their limitations and potential drawbacks:
- Lagging Nature: Like many trading indicators, the Ichimoku Cloud is a lagging indicator, meaning that it is based on past price data. This can lead to delayed signals and missed opportunities.
- Subjectivity: The interpretation of the Ichimoku Cloud can be subjective, as different traders may have different interpretations of the cloud's levels and signals.
- Whipsaws: During periods of choppy or sideways price action, the Ichimoku Cloud can generate false signals, leading to whipsaws and losses.
- Not a Holy Grail: The Ichimoku Cloud is not a foolproof system and should not be relied upon as the sole basis for trading decisions. It is essential to use other indicators and analysis techniques to confirm signals and manage risk.
Conclusion
The Ichimoku Cloud is a sophisticated and versatile indicator that offers a comprehensive view of market dynamics. By incorporating the Chikou Span as a filter, traders can enhance the reliability of signals and potentially improve their trading outcomes. However, it is crucial to understand the limitations of the indicator and to use it in conjunction with other analysis techniques and risk management strategies. The combination of the Ichimoku Cloud and Chikou Span is particularly effective during periods of trend reversal and breakout, providing valuable insights into potential entry and exit points.
Before implementing this strategy in live markets, it is highly recommended to test it thoroughly using a demo account. This will allow traders to familiarize themselves with the indicator's nuances and to fine-tune their trading parameters. With careful analysis, disciplined execution, and effective risk management, the Ichimoku Cloud and Chikou Span can be valuable assets in any trader's toolkit.
🤖 AI-Powered Trading Indicators
Win Up To 93% of Trades With the #1 Most Profitable Indicators
Unlock the power of artificial intelligence and take your trading to the next level. Our VIP Trading Indicators are designed to help you dominate any market — Forex, Crypto, Stocks — with up to 93% accuracy.
Gain instant 24/7 access to 5+ powerful, battle-tested indicators built to predict market trends with precision. Whether you're a beginner or an expert, these tools are optimized for all skill levels and work on any device.
✓ 30-Day Money Back Guarantee — Try Risk-Free!