
The realm of financial markets involves diverse strategies, many of which rely on analytical tools known as trading indicators. These mathematical calculations, derived from price and volume data, aim to forecast future price movements. One potent approach combines the Relative Strength Index (RSI) with Bollinger Bands, creating a system that can identify potential breakout opportunities and manage risk effectively. When the RSI and Bollinger Bands align, they can provide high-probability trading signals. A particularly compelling scenario arises during a Bollinger Band "squeeze," signaling a period of low volatility that often precedes a significant price surge. This article explores how to interpret these signals to enhance trading outcomes.
Understanding the Tools
To effectively utilize the synergy between the RSI and Bollinger Bands, a clear understanding of each indicator is crucial.
Quick Refresher: What is RSI?
The Relative Strength Index (RSI) is a momentum oscillator that measures the magnitude of recent price changes to evaluate overbought or oversold conditions in the price of a stock or other asset. It's primarily used to identify price trends and potential reversals. The RSI oscillates between 0 and 100. Traditionally, an RSI reading above 70 suggests that an asset is overbought and may be poised for a price decline. Conversely, an RSI reading below 30 suggests that an asset is oversold and may be due for a price increase. However, these levels can be adjusted based on the specific market conditions and the trader's individual risk tolerance. The RSI is a valuable trading indicator for discerning the strength and direction of a price trend.
How Bollinger Bands Work and What a “Squeeze” Means
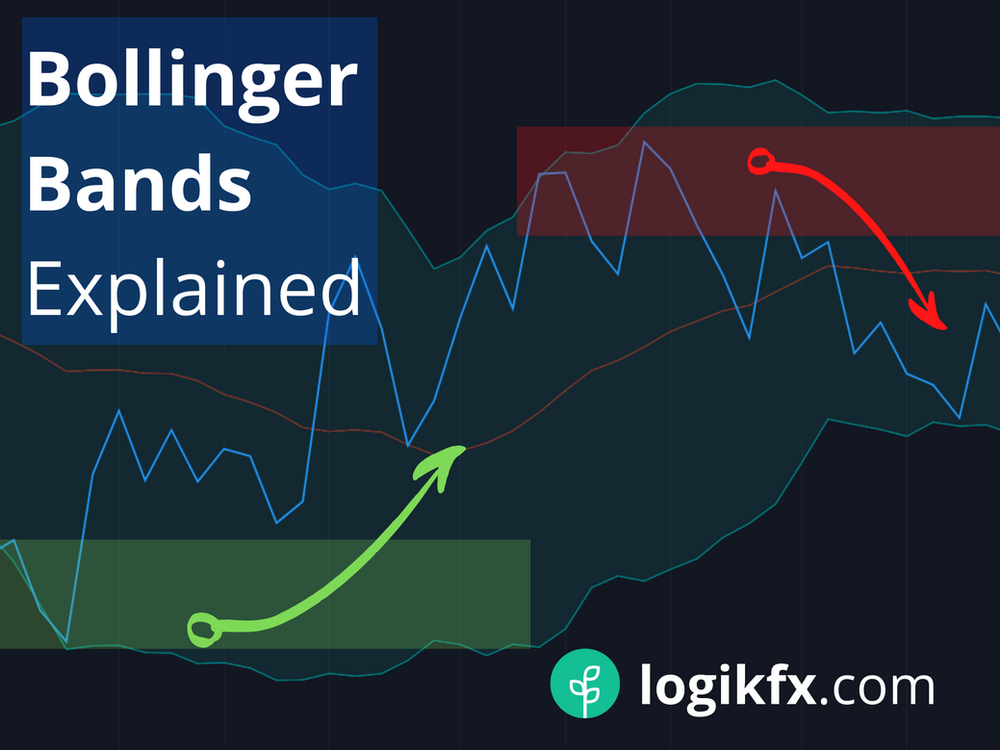
Bollinger Bands are a technical analysis tool defined by a set of lines plotted two standard deviations (positively and negatively) away from a simple moving average (SMA) of the price. The upper and lower bands dynamically adjust to price volatility. The bands widen as volatility increases and contract as volatility decreases.
A "squeeze" occurs when the Bollinger Bands contract significantly, bringing the upper and lower bands closer together. This indicates a period of low volatility. Traders often interpret a squeeze as a sign that volatility is about to increase, and a significant price move is imminent. However, the squeeze itself does not indicate the direction of the move; it simply suggests that a move is likely. A trading indicator is a tool to assist with making trading decisions.
Why Volatility Contraction Precedes Expansion
The principle behind a Bollinger Band squeeze is rooted in the cyclical nature of volatility in financial markets. Periods of high volatility are often followed by periods of consolidation and reduced price movement. This lull in activity is visually represented by the contraction of the Bollinger Bands. As market participants build up positions or wait for catalysts, the potential energy accumulates. Eventually, this pent-up energy is released, leading to a surge in price activity and a corresponding expansion of the Bollinger Bands. Understanding this cycle is key to anticipating potential breakouts.
Identifying the Setup
Identifying a high-probability setup combining the RSI and Bollinger Bands requires a keen eye and careful analysis. The following conditions can help refine the signal.
Conditions for a Valid Squeeze
A valid squeeze is characterized by a sustained period where the upper and lower Bollinger Bands narrow considerably. There's no precise measurement for how narrow the bands must be, but a good rule of thumb is to look for the narrowest band width observed over a specific lookback period (e.g., the past 20 or 30 trading sessions). A visual assessment of the chart can often be sufficient to identify significant contractions. Additionally, the price action during the squeeze should exhibit relatively small and contained movements, indicative of a lack of strong trending activity. A squeeze without this preceding constriction of bands does not qualify as a true squeeze, and can lead to false signals.
RSI in Neutral → Overbought/Oversold Transition
During the squeeze, the RSI should ideally be hovering around the neutral level (50). This signifies that neither bullish nor bearish momentum is dominant. A subsequent move of the RSI towards overbought (above 70) or oversold (below 30) territory can provide confirmation that the price is about to break out in the direction of the RSI's momentum. For example, if the Bollinger Bands are squeezing and the RSI then breaks above 70, it suggests a potential bullish breakout is imminent. Conversely, if the RSI falls below 30, a bearish breakout may be on the horizon. The RSI acts as a confirming trading indicator to validate the direction of the squeeze breakout.
Chart Example of Squeeze + RSI Divergence
Imagine a stock trading in a narrow range, with the Bollinger Bands constricting around the price. The RSI is fluctuating near 50. Suddenly, the price starts to edge upwards, breaking above the upper Bollinger Band. Simultaneously, the RSI jumps above 70, indicating overbought conditions. This combination of a breakout from the squeeze and RSI confirmation strengthens the signal, suggesting a high probability of a continued upward trend.
Conversely, consider a scenario where the price breaks below the lower Bollinger Band, and the RSI drops below 30. This would suggest a potential downward trend. Furthermore, divergence between the price action and the RSI can add further conviction to the setup. For example, if the price is making lower lows but the RSI is making higher lows during the squeeze, this bearish divergence suggests that the downward momentum is weakening, and a potential bullish reversal could occur after the breakout.
Entry & Exit Rules
Once a potential setup has been identified, it's crucial to establish clear entry and exit rules to manage risk and maximize potential profits.
Entry when Price Breaks Upper/Lower Bollinger Band with RSI Confirmation
The primary entry signal is when the price breaks above the upper Bollinger Band or below the lower Bollinger Band after a squeeze. This break should be accompanied by confirmation from the RSI, as described earlier. For a bullish entry, the price must close above the upper Bollinger Band, and the RSI should be above 70 (or a lower threshold, adjusted based on the specific asset). For a bearish entry, the price must close below the lower Bollinger Band, and the RSI should be below 30 (or a higher threshold, adjusted based on the specific asset). Waiting for the price to close beyond the band helps filter out false breakouts.
Setting Stop-Loss below Squeeze Base
A stop-loss order is an essential tool for managing risk. When entering a trade based on a Bollinger Band squeeze, the stop-loss should be placed below the base of the squeeze. For a bullish trade, this would be the lowest price reached during the squeeze period. For a bearish trade, it would be the highest price reached during the squeeze. This placement protects against the possibility of a false breakout or a failed trade. The distance between the entry price and the stop-loss level should be determined based on the trader's risk tolerance and the volatility of the asset being traded.
Profit Targets Based on ATR or Recent Swing Highs/Lows
Determining appropriate profit targets is critical for successful trading. One approach is to use the Average True Range (ATR) to estimate the potential price movement. The ATR measures the average range of price fluctuations over a specific period. A profit target can be set at a multiple of the ATR (e.g., 1x ATR, 2x ATR) from the entry price.
Another method is to identify recent swing highs (for bullish trades) or swing lows (for bearish trades) and use these levels as potential profit targets. Swing highs and lows represent significant points of resistance or support, and the price is likely to encounter these levels. The choice of profit target should depend on the trader's risk tolerance, the market conditions, and the specific characteristics of the asset being traded. It's important to remember that no trading strategy guarantees profits, and careful risk management is always essential. Combining ATR with recent swing highs/lows might provide a more robust profit target.
Risk Management Tips
Effective risk management is paramount when trading any strategy, including those involving Bollinger Bands and the RSI.
Filtering Signals with Volume or Candlestick Confirmation
To further refine trading signals, it can be beneficial to incorporate volume analysis or candlestick patterns. A breakout from a Bollinger Band squeeze accompanied by a surge in trading volume can add conviction to the signal. High volume suggests strong participation and confirms that the price move is supported by significant buying or selling pressure.
Additionally, certain candlestick patterns can provide further confirmation of the potential breakout. For example, a bullish engulfing pattern (where a large bullish candlestick completely engulfs the previous bearish candlestick) occurring at the upper Bollinger Band can signal a strong bullish move. Conversely, a bearish engulfing pattern occurring at the lower Bollinger Band can signal a strong bearish move. The use of volume and candlestick patterns is a trading indicator technique to assist with making trading decisions.
Backtesting the Strategy Over Multiple Timeframes
Before implementing any trading strategy in live markets, it's crucial to backtest it using historical data. Backtesting involves applying the strategy to past price data to evaluate its performance over different market conditions and timeframes. This process can help identify the strengths and weaknesses of the strategy and optimize its parameters.
For example, a trader might backtest the Bollinger Band squeeze strategy on daily, weekly, and monthly charts to determine which timeframe provides the most reliable signals for a particular asset. Backtesting can also reveal the optimal RSI levels and profit target multiples for that asset. By thoroughly backtesting the strategy, traders can gain confidence in its potential and make informed decisions about its implementation.
Avoiding False Breakouts During News Events
Economic news announcements and other market-moving events can trigger significant price fluctuations that can lead to false breakouts. These false breakouts can be particularly problematic for strategies that rely on Bollinger Bands, as the sudden price spikes can temporarily push the price beyond the bands before quickly reversing direction.
To mitigate this risk, it's prudent to avoid trading during periods of high-impact news announcements. Traders can consult economic calendars to identify upcoming events and plan their trading activity accordingly. Alternatively, traders can use wider stop-loss orders to account for the increased volatility associated with news events, but this approach also increases the potential risk per trade. A trading indicator is not a guaranteed profit system.
Conclusion
The combination of the RSI and Bollinger Bands offers a powerful approach to identifying potential breakout opportunities in financial markets. By understanding the principles behind each indicator and implementing appropriate risk management techniques, traders can potentially enhance their trading outcomes. The Bollinger Band squeeze, in particular, can signal periods of low volatility that often precede significant price moves. When coupled with RSI confirmation, these squeezes can provide high-probability trading signals. This trading indicator is a powerful system, but must be used cautiously.
This strategy is most effective during periods of market consolidation, where the price is trading in a narrow range and volatility is low. During these periods, the Bollinger Bands are more likely to constrict, creating the conditions for a squeeze. However, it's important to remember that no trading strategy guarantees profits, and careful risk management is always essential.
It's highly recommended to test this strategy thoroughly on a demo account before risking real capital. This allows traders to familiarize themselves with the nuances of the strategy and refine their trading skills without the pressure of financial risk. This will help prepare traders for real-world scenarios.
🤖 AI-Powered Trading Indicators
Win Up To 93% of Trades With the #1 Most Profitable Indicators
Unlock the power of artificial intelligence and take your trading to the next level. Our VIP Trading Indicators are designed to help you dominate any market — Forex, Crypto, Stocks — with up to 93% accuracy.
Gain instant 24/7 access to 5+ powerful, battle-tested indicators built to predict market trends with precision. Whether you're a beginner or an expert, these tools are optimized for all skill levels and work on any device.
✓ 30-Day Money Back Guarantee — Try Risk-Free!