
In the realm of financial markets, technical analysis serves as a cornerstone for many traders aiming to decipher price movements and forecast future trends. A plethora of analytical tools, often referred to as Trading Indicators, are available to assist in this endeavor. Among these, the Moving Average Convergence Divergence (MACD) indicator stands out as a versatile and widely utilized instrument. The MACD's histogram component, in particular, offers valuable insights into the momentum shifts within a security's price action. A specific pattern known as the "MACD Histogram Flip" can signal potential buying or selling opportunities. This article delves into the intricacies of the MACD Histogram Flip pattern, exploring its identification, interpretation, and application in trading strategies.
Understanding the MACD and Its Histogram
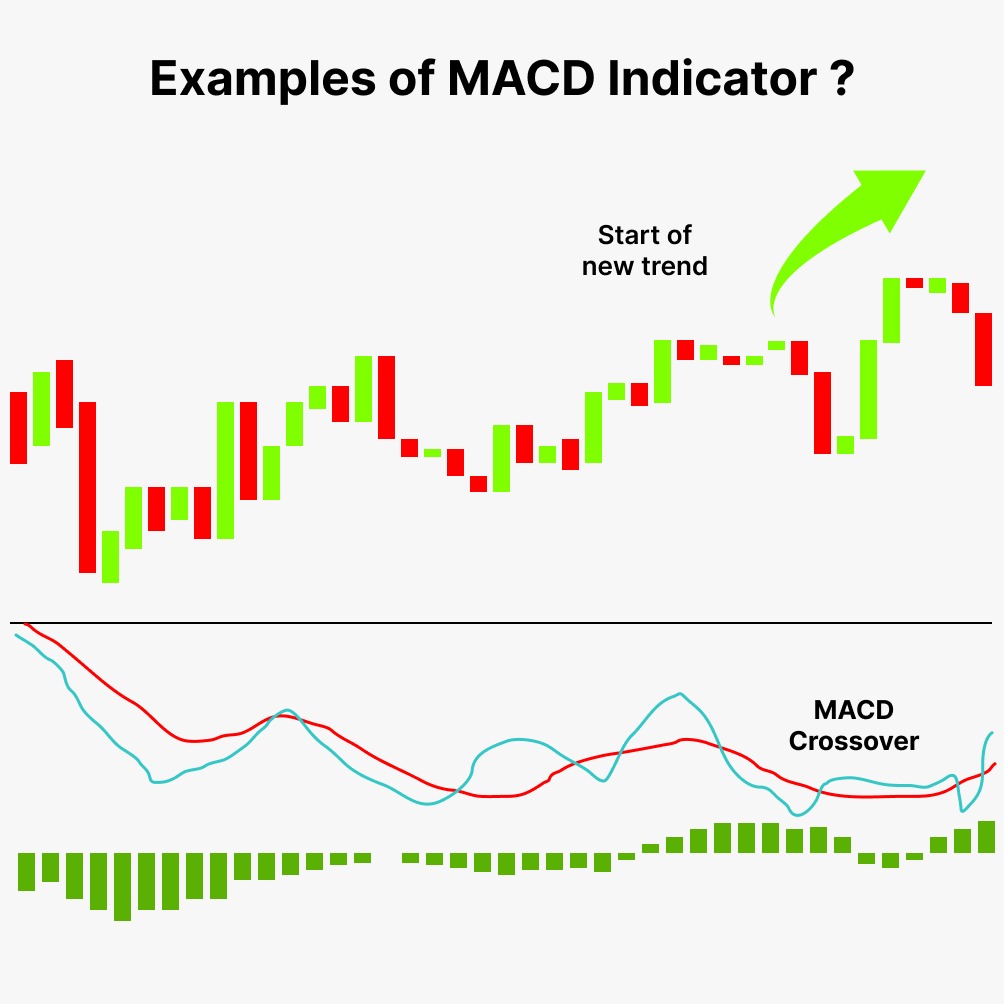
The MACD, developed by Gerald Appel in the late 1970s, is a trend-following momentum indicator that illustrates the relationship between two moving averages of a security’s price. It is calculated by subtracting the 26-period Exponential Moving Average (EMA) from the 12-period EMA. This difference forms the MACD line. A 9-period EMA of the MACD line, known as the Signal line, is then plotted on top of the MACD line. The MACD Histogram, which is the primary focus of this analysis, represents the difference between the MACD line and the Signal line. It provides a visual representation of the momentum change and can offer early signals of potential trend reversals.
Decoding the MACD Histogram
The MACD Histogram oscillates above and below the zero line, providing a clear visual cue of the momentum direction. When the histogram is above zero, it indicates that the MACD line is above the Signal line, suggesting bullish momentum. Conversely, when the histogram is below zero, it signals that the MACD line is below the Signal line, indicating bearish momentum. The height of the histogram bars represents the strength of the momentum. Taller bars suggest stronger momentum, while shorter bars indicate weakening momentum. Understanding this fundamental aspect of the histogram is crucial for identifying the MACD Histogram Flip pattern.
What is a MACD Histogram Flip?
The MACD Histogram Flip occurs when the histogram changes direction, crossing the zero line from positive to negative (bearish flip) or from negative to positive (bullish flip). This flip suggests a shift in momentum, indicating a potential trend reversal. A bullish flip happens when the histogram moves from below the zero line to above it, signaling a possible uptrend. A bearish flip occurs when the histogram moves from above the zero line to below it, indicating a possible downtrend. This pattern, when combined with other Trading Indicators, can provide a more robust signal for entry or exit points.
Identifying Bullish MACD Histogram Flips
A bullish MACD Histogram Flip occurs when the histogram transitions from negative values to positive values. This transition suggests that the shorter-term moving average (12-period EMA) is starting to rise more rapidly than the longer-term moving average (26-period EMA), indicating increasing upward momentum. To identify a valid bullish flip, look for the following conditions:
- The histogram bars are consistently below the zero line.
- The histogram bars start to decrease in negative value, approaching the zero line.
- A histogram bar crosses above the zero line, confirming the bullish flip.
- Confirmation from other Trading Indicators such as the Relative Strength Index (RSI) or volume indicators.
Identifying Bearish MACD Histogram Flips
A bearish MACD Histogram Flip occurs when the histogram transitions from positive values to negative values. This transition suggests that the shorter-term moving average is starting to decline more rapidly than the longer-term moving average, indicating increasing downward momentum. To identify a valid bearish flip, look for the following conditions:
- The histogram bars are consistently above the zero line.
- The histogram bars start to decrease in positive value, approaching the zero line.
- A histogram bar crosses below the zero line, confirming the bearish flip.
- Confirmation from other Trading Indicators to validate the signal.
Using the MACD Histogram Flip for Buy Signals
A bullish MACD Histogram Flip can be used as a buy signal, indicating a potential entry point for a long position. However, it is crucial to confirm the signal with other technical indicators and price action analysis. Several strategies can be employed:
- Confirmation with RSI: A bullish flip occurring when the RSI is above 30 (but not overbought) can strengthen the buy signal.
- Volume Confirmation: An increase in trading volume during the bullish flip can validate the signal, suggesting strong buying pressure.
- Price Action Confirmation: A break above a recent high or a trendline coinciding with the bullish flip can provide further confirmation.
Once a buy signal is confirmed, a trader can enter a long position with a stop-loss order placed below a recent swing low to manage risk. Profit targets can be set based on previous resistance levels or using techniques like Fibonacci extensions.
Using the MACD Histogram Flip for Sell Signals
A bearish MACD Histogram Flip can be used as a sell signal, indicating a potential entry point for a short position or an exit point for a long position. Similar to the buy signal, it is essential to confirm the sell signal with other indicators and price action analysis. Strategies include:
- Confirmation with RSI: A bearish flip occurring when the RSI is below 70 (but not oversold) can strengthen the sell signal.
- Volume Confirmation: An increase in trading volume during the bearish flip can validate the signal, suggesting strong selling pressure.
- Price Action Confirmation: A break below a recent low or a trendline coinciding with the bearish flip can provide further confirmation.
Upon confirmation of a sell signal, a trader can enter a short position with a stop-loss order placed above a recent swing high to manage risk. Profit targets can be set based on previous support levels or using techniques like Fibonacci retracements.
Combining MACD Histogram Flips with Other Trading Indicators
While the MACD Histogram Flip can provide valuable insights, it is not infallible. To increase the accuracy and reliability of the signals, it is recommended to combine it with other Trading Indicators. Here are a few popular combinations:
- RSI (Relative Strength Index): As mentioned previously, using the RSI to confirm overbought or oversold conditions can filter out false signals.
- Moving Averages: Combining the MACD Histogram Flip with moving averages can help identify the overall trend direction. For example, a bullish flip occurring above a long-term moving average can indicate a strong uptrend.
- Volume Indicators: Volume indicators like the On Balance Volume (OBV) or the Volume Price Trend (VPT) can confirm the strength of the momentum shift signaled by the MACD Histogram Flip.
- Fibonacci Retracement Levels: Identifying key support and resistance levels using Fibonacci retracements can provide additional context for the MACD Histogram Flip signals.
- Bollinger Bands: When the price action tests the upper or lower bands and a Histogram Flip occurs, it can provide a good potential entry.
Example Scenario: Bullish Flip with RSI Confirmation
Consider a hypothetical scenario where a stock has been trading in a downtrend. The MACD histogram has been consistently below the zero line, indicating bearish momentum. However, the histogram bars start to decrease in negative value, suggesting a weakening downtrend. At the same time, the RSI is hovering around 35, indicating that the stock is approaching oversold conditions. Suddenly, the histogram crosses above the zero line, signaling a bullish flip. Simultaneously, the RSI breaks above 40, confirming the increasing upward momentum. This combination of the bullish MACD Histogram Flip and RSI confirmation presents a strong buy signal. A trader could enter a long position with a stop-loss order placed below a recent swing low.
Example Scenario: Bearish Flip with Volume Confirmation
Now, consider a scenario where a stock has been trading in an uptrend. The MACD histogram has been consistently above the zero line, indicating bullish momentum. However, the histogram bars start to decrease in positive value, suggesting a weakening uptrend. Simultaneously, there is a significant increase in trading volume. The histogram then crosses below the zero line, signaling a bearish flip. The increased volume during the bearish flip confirms the strong selling pressure. This combination of the bearish MACD Histogram Flip and volume confirmation presents a strong sell signal. A trader could enter a short position with a stop-loss order placed above a recent swing high.
Risk Management Considerations
While the MACD Histogram Flip can be a valuable tool, it is essential to implement proper risk management strategies. Here are some key considerations:
- Stop-Loss Orders: Always use stop-loss orders to limit potential losses. Place stop-loss orders strategically below recent swing lows for long positions and above recent swing highs for short positions.
- Position Sizing: Carefully determine the appropriate position size based on risk tolerance and account size. Avoid risking more than a small percentage of the trading account on any single trade.
- Diversification: Diversify the investment portfolio across multiple assets to reduce overall risk.
- Backtesting: Before implementing the MACD Histogram Flip strategy with real capital, thoroughly backtest it on historical data to evaluate its performance and identify potential weaknesses.
The Importance of Backtesting
Backtesting involves applying the MACD Histogram Flip strategy to historical price data to assess its effectiveness. This process can reveal valuable insights into the strategy's win rate, average profit per trade, and maximum drawdown. By backtesting, traders can fine-tune the strategy's parameters and identify the most optimal settings for different market conditions. Backtesting also helps to build confidence in the strategy before risking real capital.
Avoiding False Signals
Like all technical indicators, the MACD Histogram Flip can generate false signals. False signals occur when the indicator suggests a potential trend reversal, but the price action fails to follow through. To minimize the risk of false signals, consider the following tips:
- Use Multiple Confirmations: As emphasized earlier, always confirm the MACD Histogram Flip signal with other technical indicators and price action analysis.
- Consider Market Con Take into account the overall market trend and economic conditions. Avoid trading against the prevailing trend.
- Be Patient: Wait for clear confirmation of the signal before entering a trade. Avoid jumping into trades prematurely based on a single indicator.
- Understand News Events: Be aware of upcoming economic news releases or events that could impact the market. These events can cause sudden price spikes and false signals.
Adapting the Strategy to Different Timeframes
The MACD Histogram Flip strategy can be applied to various timeframes, from short-term intraday charts to long-term weekly or monthly charts. However, the effectiveness of the strategy may vary depending on the timeframe. Shorter timeframes tend to generate more frequent signals, but these signals may also be less reliable due to increased noise. Longer timeframes provide fewer signals, but these signals tend to be more robust and reliable. Traders should experiment with different timeframes to determine the most suitable setting for their trading style and risk tolerance.
Conclusion
The MACD Histogram Flip is a valuable tool for identifying potential trend reversals and generating buy or sell signals. By understanding the underlying principles of the MACD indicator and combining the Histogram Flip with other Trading Indicators and price action analysis, traders can enhance the accuracy and reliability of their trading decisions. However, it is crucial to implement proper risk management strategies and thoroughly backtest the strategy before risking real capital. The MACD Histogram Flip is most effective when the market is consolidating, showing the potential for breakouts. Remember, no Trading Indicator is foolproof. Practice, discipline, and continuous learning are essential for success in the financial markets.
🤖 AI-Powered Trading Indicators
Win Up To 93% of Trades With the #1 Most Profitable Indicators
Unlock the power of artificial intelligence and take your trading to the next level. Our VIP Trading Indicators are designed to help you dominate any market — Forex, Crypto, Stocks — with up to 93% accuracy.
Gain instant 24/7 access to 5+ powerful, battle-tested indicators built to predict market trends with precision. Whether you're a beginner or an expert, these tools are optimized for all skill levels and work on any device.
✓ 30-Day Money Back Guarantee — Try Risk-Free!