
The pursuit of consistent profitability in the financial markets often leads traders to explore various indicator-based strategies. These strategies use mathematical calculations based on historical price and volume data to generate trading signals. One compelling approach involves combining the Relative Strength Index (RSI) with Bollinger Bands to identify potential high-probability trading opportunities. This method capitalizes on periods of market consolidation followed by explosive breakouts, using the RSI to confirm the strength and direction of the move.
Understanding the Tools
A foundational understanding of both the Relative Strength Index and Bollinger Bands is crucial before implementing this strategy. Each indicator offers unique insights into price action, and their combined analysis can significantly enhance trading accuracy.
Quick Refresher: What is RSI?
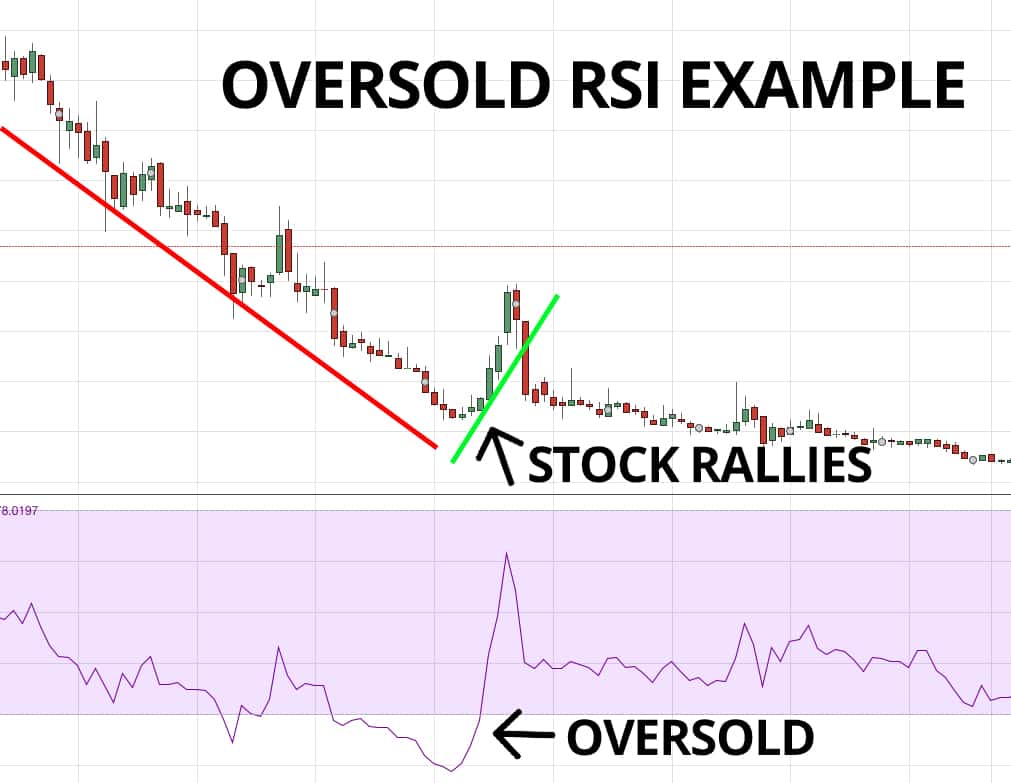
The Relative Strength Index (RSI) is a momentum oscillator that measures the magnitude of recent price changes to evaluate overbought or oversold conditions in the price of a stock or other asset. It is primarily used to identify price trends and potential reversals. The RSI is displayed as an oscillator that can range from 0 to 100. An asset is typically considered overbought when the RSI is above 70 and oversold when it is below
30. However, these levels can be adjusted depending on the specific asset and market conditions.
The RSI's usefulness extends beyond simply identifying overbought and oversold conditions. It can also be used to spot divergences, where the price of an asset is making new highs (or lows) while the RSI is not. This divergence can be a signal of a potential trend reversal. For example, if the price is making higher highs but the RSI is making lower highs, it could indicate that the bullish momentum is weakening.
How Bollinger Bands Work and What a "Squeeze" Means
Bollinger Bands consist of a simple moving average (SMA) and two bands plotted above and below the SMA. These bands are typically two standard deviations away from the SMA. The bands widen and narrow as volatility increases and decreases, respectively. The standard calculation uses a 20-day SMA, but this parameter can also be adjusted based on individual preferences and market conditions.
A "squeeze" occurs when the Bollinger Bands contract, indicating a period of low volatility. This contraction suggests that the market is consolidating, and a significant price move is imminent. Traders often interpret a squeeze as a precursor to a breakout, anticipating that the price will eventually break out of the tight range established by the contracting bands.
Why Volatility Contraction Precedes Expansion
The principle behind the volatility squeeze is based on the tendency of markets to alternate between periods of consolidation and periods of trending. When volatility is low, market participants are often unsure of the next direction, leading to a sideways movement. This period of indecision cannot last indefinitely. Eventually, a catalyst or event will trigger a surge in buying or selling pressure, causing the price to break out of the consolidation range. The Bollinger Bands visually represent this phenomenon, contracting during consolidation and expanding during breakouts.
Identifying the Setup
The power of the RSI and Bollinger Bands combination lies in its ability to identify potential breakout opportunities with enhanced accuracy. By carefully analyzing the interaction between these indicators, traders can pinpoint situations where a significant price move is likely to occur.
Conditions for a Valid Squeeze
Not all squeezes are created equal. To improve the odds of a successful trade, it's important to identify specific characteristics that indicate a high-probability squeeze setup. Bandwidth Contraction: The distance between the upper and lower Bollinger Bands should be noticeably narrower than its historical average, confirming a period of low volatility. Extended Consolidation: The price should have been trading within a relatively tight range for a sustained period, indicating market indecision. Reduced Volume: Volume often decreases during periods of consolidation, suggesting a lack of strong conviction among buyers and sellers.
RSI in Neutral → Overbought/Oversold Transition
The RSI plays a crucial role in confirming the direction and strength of a potential breakout following a squeeze. Ideally, the RSI should be hovering around the neutral level (50) during the squeeze, indicating that neither buyers nor sellers have a clear advantage. As the price breaks out of the Bollinger Bands, the RSI should transition towards overbought (above 70) in an upward breakout or oversold (below 30) in a downward breakout. This movement confirms that the breakout is accompanied by strong momentum, increasing the likelihood of a sustained move.
Chart Example of Squeeze + RSI Confirmation
Consider a hypothetical example of a stock trading within a narrow range for several weeks. The Bollinger Bands are visibly contracting, indicating a squeeze. The RSI is fluctuating around 50. Suddenly, the price breaks above the upper Bollinger Band on increasing volume, and the RSI quickly moves above
70. This scenario presents a potentially strong buy signal, suggesting that the stock is likely to continue moving higher.
Entry & Exit Rules
Establishing clear entry and exit rules is essential for any successful trading strategy. These rules help to eliminate emotional decision-making and ensure a disciplined approach to trading.
Entry When Price Breaks Upper/Lower Bollinger Band with RSI Confirmation
The primary entry signal for this strategy is when the price breaks above the upper Bollinger Band (for a long position) or below the lower Bollinger Band (for a short position), accompanied by RSI confirmation. The RSI confirmation means that the RSI should be above 70 for a long entry or below 30 for a short entry. The candlestick breaking the band should ideally close above or below the band, showing commitment of market participants to the breakout direction.
Setting Stop-Loss Below Squeeze Base
A stop-loss order is crucial for managing risk. A common approach is to place the stop-loss order below the base of the squeeze. This level represents a significant support level for long positions and a resistance level for short positions. If the price retraces below this level, it suggests that the breakout is likely a false signal, and the position should be exited to minimize losses. A more conservative approach might consider placing the stop-loss order slightly below the lower Bollinger Band or above the upper Bollinger Band, depending on the trade direction.
Profit Targets Based on ATR or Recent Swing Highs/Lows
Determining appropriate profit targets is just as important as setting stop-loss orders. One approach is to use the Average True Range (ATR) to estimate the potential price movement. For example, a trader might set a profit target equal to two or three times the ATR. Another approach is to identify recent swing highs or lows and use them as potential profit targets. These levels represent areas where the price is likely to encounter resistance or support, respectively. The chosen method should align with the trader’s risk tolerance and trading style. The risk-reward ratio should be above 1:2, or preferably 1:3, for this strategy to be viable in the long run.
Risk Management Tips
Effective risk management is paramount to long-term trading success. By implementing sound risk management techniques, traders can protect their capital and minimize the impact of losing trades.
Filtering Signals with Volume or Candlestick Confirmation
Volume can be a valuable tool for confirming the validity of breakout signals. Ideally, the breakout should be accompanied by a significant increase in volume, indicating strong buying or selling pressure. Candlestick patterns can also provide additional confirmation. For example, a bullish engulfing pattern occurring at the same time as a breakout above the upper Bollinger Band can strengthen the buy signal. Similarly, a bearish engulfing pattern occurring at the same time as a breakout below the lower Bollinger Band can strengthen the sell signal.
Backtesting the Strategy Over Multiple Timeframes
Before implementing any trading strategy with real money, it's essential to backtest it over historical data. Backtesting involves applying the strategy to past price data to assess its performance and identify potential weaknesses. This process should be conducted across multiple timeframes to determine the strategy's effectiveness in different market conditions. The data should be tested for both bear and bull markets to provide a more rounded perspective. It is prudent to also forward test the strategy on a demo account to assess real-time performance.
Avoiding False Breakouts During News Events
News events can trigger significant price volatility, leading to false breakouts. It's generally advisable to avoid trading this strategy during major news announcements, such as interest rate decisions, earnings releases, or economic data releases. These events can cause unpredictable price swings that can invalidate the signals generated by the RSI and Bollinger Bands.
Conclusion
The combination of the Relative Strength Index and Bollinger Band squeeze offers a powerful approach to identifying potential breakout opportunities in the financial markets. By carefully analyzing the interaction between these indicators, traders can enhance their trading accuracy and improve their risk-adjusted returns. The most effective application of this strategy occurs during periods of market consolidation, where the Bollinger Bands contract and the RSI hovers near neutral. This setup provides a clear indication that a significant price move is imminent, and the RSI can be used to confirm the direction and strength of the breakout.
The RSI Displacement Zone strategy is not a guaranteed path to riches, but a tool. Market knowledge, rigorous backtesting, and stringent risk-management must be implemented to support the strategy.
It is encouraged to test this strategy using a demo account before risking real capital. This allows the strategy to be further refined and provides the opportunity to become familiar with the market conditions where this strategy is most effective.
🤖 AI-Powered Trading Indicators
Win Up To 93% of Trades With the #1 Most Profitable Indicators
Unlock the power of artificial intelligence and take your trading to the next level. Our VIP Trading Indicators are designed to help you dominate any market — Forex, Crypto, Stocks — with up to 93% accuracy.
Gain instant 24/7 access to 5+ powerful, battle-tested indicators built to predict market trends with precision. Whether you're a beginner or an expert, these tools are optimized for all skill levels and work on any device.
✓ 30-Day Money Back Guarantee — Try Risk-Free!