
Indicator-based strategies offer a structured approach to navigating the complexities of financial markets. By combining the strengths of different tools, traders aim to identify high-probability setups and execute trades with precision. One such powerful combination involves the Relative Strength Index (RSI) and Bollinger Bands. Integrating the RSI with Bollinger Bands can provide a robust framework for spotting potential trend continuations and reversals. Understanding the dynamics of a Bollinger Band "squeeze" is crucial, as it often signals an impending period of significant market movement. This approach enhances a trader's ability to capitalize on market volatility while managing risk effectively. Using several trading indicators could improve profitability.
Understanding the Tools
Before diving into the specifics of the strategy, it's important to have a firm grasp of the individual indicators involved.
Quick Refresher: What is RSI?
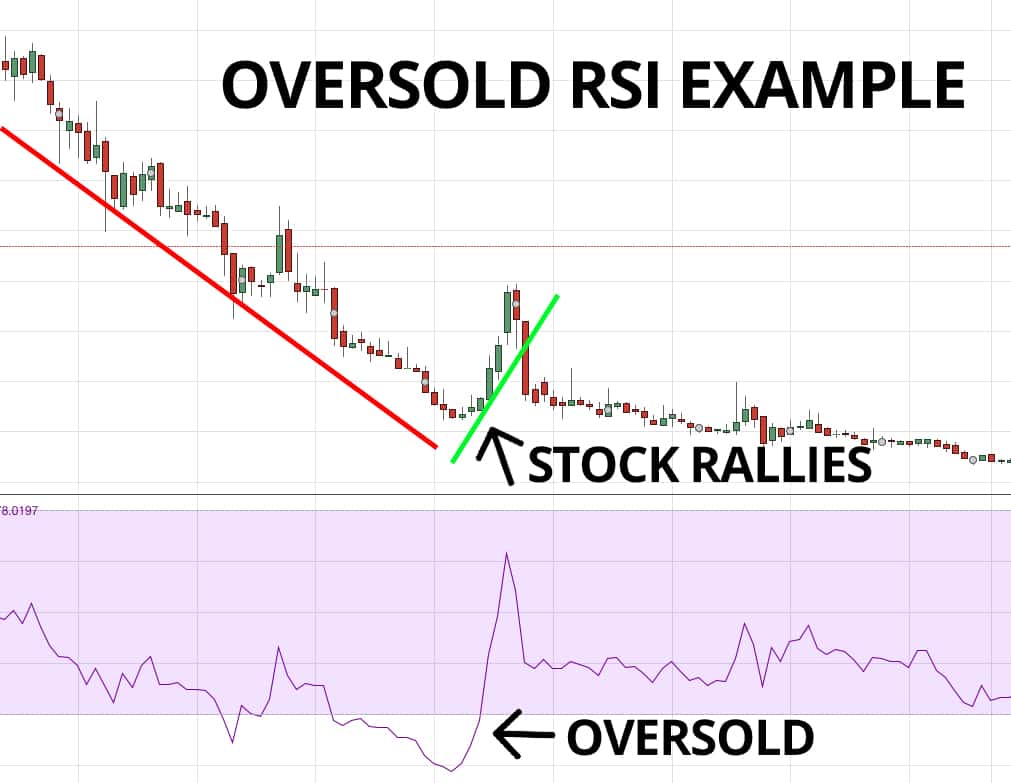
The Relative Strength Index (RSI) is a momentum oscillator that measures the speed and change of price movements. It oscillates between 0 and 100. Conventionally, RSI readings above 70 are considered to indicate overbought conditions, suggesting the asset may be overvalued and prone to a price decrease. Conversely, RSI readings below 30 are typically seen as oversold conditions, suggesting the asset may be undervalued and poised for a price increase. However, it's important to note that overbought and oversold conditions can persist for extended periods, especially in trending markets. The RSI is a vital element within trading indicators.
How Bollinger Bands Work and What a “Squeeze” Means
Bollinger Bands consist of a simple moving average (SMA) and two bands plotted at standard deviations above and below the SMA. These bands dynamically adjust to market volatility. When the price is close to the upper band, it suggests the price is relatively high, and when it's close to the lower band, it suggests the price is relatively low. A "squeeze" occurs when the Bollinger Bands narrow, indicating a period of low volatility. This contraction often precedes a significant price move, as periods of low volatility are typically followed by periods of high volatility. This is due to markets alternating between consolidation and trending phases. The squeeze is a visual cue that a breakout is imminent.
Why Volatility Contraction Precedes Expansion
The principle behind volatility contraction leading to expansion is rooted in market dynamics. During periods of consolidation, price movements are constrained, and market participants are often indecisive. This results in a decrease in volatility, causing the Bollinger Bands to narrow. However, this state of equilibrium cannot last forever. Eventually, a catalyst, such as a news event, earnings report, or shift in market sentiment, will trigger a breakout. This breakout leads to a surge in volatility as the market establishes a new direction. Traders often use the squeeze as a signal to prepare for potential trading opportunities, anticipating that a significant price move is on the horizon.
Identifying the Setup
The effectiveness of this strategy relies on accurately identifying the setup. This involves recognizing a valid squeeze and observing the RSI's behavior in relation to the squeeze.
Conditions for a Valid Squeeze
A valid squeeze is characterized by a prolonged period of low volatility, where the upper and lower Bollinger Bands move closer together. The bands should be noticeably narrower than their historical average. Some traders use a specific bandwidth percentage (the difference between the upper and lower bands divided by the middle band) as a quantitative measure to define a squeeze. It's important to visually confirm the squeeze on the chart and ensure that the price action is indeed consolidating within a tight range. Avoid squeezes that are too short in duration, as these may simply be temporary pauses in a larger trend. The longer the squeeze, the greater the potential for a significant breakout.
RSI in Neutral → Overbought/Oversold Transition
The RSI plays a crucial role in confirming the validity of the squeeze setup. Ideally, the RSI should be oscillating around the neutral level (50) during the squeeze. This indicates that neither buyers nor sellers are in control, which is consistent with a period of consolidation. As the price begins to break out from the squeeze, the RSI should transition towards overbought or oversold territory, depending on the direction of the breakout. For a bullish breakout, the RSI should move above 50 and ideally approach or enter overbought levels (above 70), confirming the upward momentum. Conversely, for a bearish breakout, the RSI should move below 50 and ideally approach or enter oversold levels (below 30), confirming the downward momentum. The combination of a squeeze breakout and RSI confirmation provides a strong signal for a potential trade.
Chart Example of Squeeze + RSI Divergence
To illustrate the setup, consider a hypothetical chart example. Suppose a stock has been trading sideways for several weeks, with the Bollinger Bands narrowing significantly. The RSI has been oscillating around 50, indicating a neutral market sentiment. Suddenly, the stock price breaks above the upper Bollinger Band. Simultaneously, the RSI surges above 70, confirming the overbought condition and the strength of the upward momentum. This scenario presents a high-probability trading opportunity. Conversely, if the stock price breaks below the lower Bollinger Band and the RSI drops below 30, it signals a potential bearish trade. It is also helpful to analyze the trend by checking the trading indicators.
Entry & Exit Rules
Once a valid setup is identified, it's important to have clear entry and exit rules to manage risk and maximize potential profits.
Entry When Price Breaks Upper/Lower Bollinger Band with RSI Confirmation
The entry signal occurs when the price decisively breaks above the upper Bollinger Band (for a long trade) or below the lower Bollinger Band (for a short trade), accompanied by RSI confirmation. A "decisive" break means that the price closes beyond the band, rather than just briefly touching it. The RSI confirmation adds an extra layer of validation, ensuring that the breakout is supported by momentum. Some traders prefer to wait for a candlestick to close outside the band before entering, while others may enter on the break itself. The choice depends on individual risk tolerance and trading style.
Setting Stop-Loss Below Squeeze Base
A stop-loss order is essential for limiting potential losses. A common strategy is to place the stop-loss order below the base of the squeeze. For a long trade, the stop-loss would be placed slightly below the lowest price reached during the squeeze. For a short trade, the stop-loss would be placed slightly above the highest price reached during the squeeze. This placement aims to protect the trade from false breakouts, while still allowing it room to breathe. The exact distance of the stop-loss from the squeeze base will depend on the volatility of the asset being traded. A more volatile asset may require a wider stop-loss to avoid being prematurely stopped out.
Profit Targets Based on ATR or Recent Swing Highs/Lows
Determining profit targets is crucial for capturing gains. One approach is to use the Average True Range (ATR) to project potential price movement. The ATR measures the average range of price fluctuations over a given period. A trader might set a profit target that is a multiple of the ATR away from the entry price. For example, a profit target could be set at 2 times the ATR. Another approach is to use recent swing highs and lows as potential profit targets. For a long trade, the profit target could be set at the next significant swing high. For a short trade, the profit target could be set at the next significant swing low. These swing points often act as areas of support and resistance, making them logical places to take profits.
Risk Management Tips
Effective risk management is paramount for the long-term success of any trading strategy.
Filtering Signals with Volume or Candlestick Confirmation
To further refine the signals generated by the RSI and Bollinger Band squeeze, it's helpful to incorporate additional filters. Volume can provide valuable insights into the strength of a breakout. A breakout accompanied by high volume is generally considered more reliable than a breakout with low volume. Candlestick patterns can also offer confirmation. For example, a bullish engulfing pattern or a strong marubozu candlestick breaking above the upper Bollinger Band would strengthen the bullish signal. Conversely, a bearish engulfing pattern or a strong marubozu candlestick breaking below the lower Bollinger Band would strengthen the bearish signal. These filters help to weed out false breakouts and improve the overall accuracy of the strategy.
Backtesting the Strategy Over Multiple Timeframes
Backtesting involves applying the strategy to historical data to assess its performance. This allows traders to evaluate the strategy's win rate, profitability, and drawdown over different market conditions. It's important to backtest the strategy over multiple timeframes to determine its optimal settings and identify any potential weaknesses. For example, the strategy may perform well on a daily timeframe but poorly on a 15-minute timeframe. Backtesting provides valuable insights into the strategy's strengths and limitations, allowing traders to make informed decisions about its application in live trading. Using various trading indicators while backtesting improves the results.
Avoiding False Breakouts During News Events
News events can cause significant volatility in financial markets, leading to false breakouts and whipsaws. It's prudent to avoid trading the RSI and Bollinger Band squeeze strategy during major news announcements, such as economic data releases or central bank policy statements. These events can trigger sudden price movements that invalidate the squeeze setup. Traders should be aware of the economic calendar and avoid entering trades in the lead-up to and immediately after these events. Alternatively, they can reduce their position size to mitigate the risk of adverse price movements. The goal is to protect capital and avoid being caught on the wrong side of a news-driven spike.
Conclusion
The combined power of the RSI and Bollinger Band squeeze offers a robust approach to identifying potential trading opportunities. By understanding the dynamics of volatility contraction and expansion, and by using the RSI to confirm momentum, traders can enhance their ability to capitalize on market movements. This strategy is particularly effective during periods of market consolidation, where the Bollinger Bands narrow and the RSI oscillates around neutral levels. In these conditions, the squeeze acts as a coiled spring, ready to unleash pent-up energy in the form of a breakout. The RSI provides confirmation that the breakout is supported by momentum, increasing the probability of a successful trade.
However, it's important to remember that no trading strategy is foolproof. The RSI and Bollinger Band squeeze is just one tool in a trader's arsenal, and it should be used in conjunction with other forms of technical analysis and fundamental analysis. Risk management is also crucial. Traders should always use stop-loss orders to limit potential losses and should avoid risking more than they can afford to lose.
Before implementing this strategy in live trading, it's highly recommended to test it thoroughly with a demo account. This allows traders to familiarize themselves with the setup, practice their entry and exit rules, and fine-tune their risk management techniques without risking real money. With patience, discipline, and a commitment to continuous learning, the RSI and Bollinger Band squeeze can be a valuable addition to any trader's toolkit.
🤖 AI-Powered Trading Indicators
Win Up To 93% of Trades With the #1 Most Profitable Indicators
Unlock the power of artificial intelligence and take your trading to the next level. Our VIP Trading Indicators are designed to help you dominate any market — Forex, Crypto, Stocks — with up to 93% accuracy.
Gain instant 24/7 access to 5+ powerful, battle-tested indicators built to predict market trends with precision. Whether you're a beginner or an expert, these tools are optimized for all skill levels and work on any device.
✓ 30-Day Money Back Guarantee — Try Risk-Free!