
In financial marketplaces, many participants employ indicator-based strategies to discern potential entry and exit points. Combining distinct indicators can often yield a more robust and nuanced perspective than relying on a solitary tool. One particularly effective pairing involves the Relative Strength Index (RSI) and the Stochastic RSI. This combination aims to capture both the momentum and the degree of overbought or oversold conditions within an asset, potentially leading to more refined signals and improved outcomes. This discussion will explore the synergistic relationship between these two Trading Indicators, their individual functions, and how they can be strategically utilized for enhanced analysis.
Understanding the Tools
Before delving into the combined application of the Relative Strength Index (RSI) and the Stochastic RSI, it's beneficial to understand each tool's individual mechanics and purpose.
Quick Refresher: What is RSI?
The Relative Strength Index (RSI) is a momentum indicator utilized in technical analysis. It gauges the magnitude of recent price changes to evaluate overbought or oversold conditions in the pricing of an asset. The RSI is displayed as an oscillator, which can have a value between 0 and 100. Traditionally, an RSI reading above 70 is considered to indicate an overbought condition, suggesting a potential price reversal to the downside. Conversely, an RSI reading below 30 is considered to indicate an oversold condition, suggesting a potential price reversal to the upside. However, these levels can be adjusted to suit different assets and timeframes.
The RSI is calculated using the following formula:
RSI = 100 - [100 / (1 + (Average Gain / Average Loss))]
The average gain and average loss are calculated over a specified period, typically 14 periods. A higher average gain relative to the average loss results in a higher RSI value, and vice versa.
The RSI is a valuable indicator for identifying potential trend reversals and confirming trend strength. It is also used to spot divergences between the price and the oscillator, which can be a powerful signal of an impending reversal.
How Stochastic RSI works
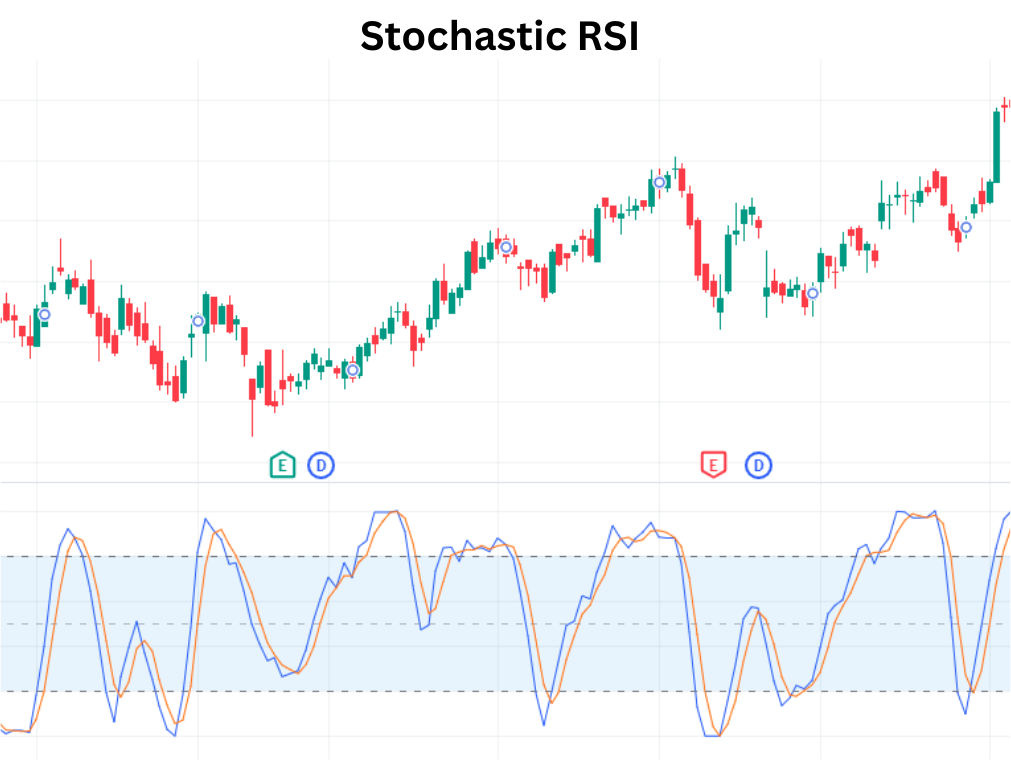
The Stochastic RSI, on the other hand, is an indicator applied to the RSI itself, rather than directly to price. In essence, it is an "indicator of an indicator." Developed by Tushar Chande and Stanley Kroll, it is designed to make the RSI more sensitive to recent price action. The Stochastic RSI oscillates between 0 and 1, or 0 and 100, depending on the charting platform's presentation. The formula for Stochastic RSI is:
Stochastic RSI = (RSI - Lowest RSI) / (Highest RSI - Lowest RSI)
Where:
RSI = The current RSI value
Lowest RSI = The lowest RSI value over the specified period
Highest RSI = The highest RSI value over the specified period
Similar to the RSI, the Stochastic RSI employs overbought and oversold levels to generate signals. Values above 0.8 (or 80) typically suggest an overbought situation, while values below
0.2 (or 20) suggest an oversold situation. Because the Stochastic RSI is more sensitive, it tends to generate more frequent signals than the regular RSI. This sensitivity can be both an advantage and a disadvantage. It allows for earlier detection of potential trading opportunities, but it can also lead to more false signals.
Why Combine the Two?
The key reason for combining the RSI and Stochastic RSI lies in their complementary nature. The RSI provides a broader view of momentum and identifies potential overbought and oversold conditions based on price action. The Stochastic RSI, in turn, refines these signals by measuring the RSI's momentum itself. This combination can help filter out false signals and provide more accurate entry and exit points.
Here are some key advantages of using the two Trading Indicators in conjunction:
- Confirmation of Signals: When both RSI and Stochastic RSI indicate overbought or oversold conditions simultaneously, it strengthens the validity of the signal.
- Early Entry Points: The Stochastic RSI's sensitivity can help identify potential entry points before the RSI gives a clear signal. This allows for potentially better prices and increased profit potential.
- Filtering False Signals: By requiring confirmation from both Trading Indicators, the number of false signals can be reduced, leading to more disciplined and successful analysis.
- Identifying Divergence: The RSI and Stochastic RSI can both be used to identify divergences between price and momentum. When these divergences occur in both Trading Indicators, it is a strong indication of a potential trend reversal.
Identifying the Setup
To effectively utilize the combined power of the RSI and Stochastic RSI, it's essential to identify specific setup conditions that suggest a high-probability trading opportunity.
Conditions for Setup
Several conditions typically need to be met before considering a trade based on the combined RSI and Stochastic RSI setup. While these conditions can be adjusted based on individual trading styles and market conditions, the following provides a solid foundation:
- Overbought/Oversold Levels: The primary condition is that both the RSI and Stochastic RSI should be indicating overbought or oversold conditions. For a buy signal, both indicators should be below their respective oversold levels (typically 30 for RSI and 20 for Stochastic RSI). For a sell signal, both indicators should be above their respective overbought levels (typically 70 for RSI and 80 for Stochastic RSI).
- Confirmation of Crossovers: A crossover in the Stochastic RSI can provide additional confirmation of the signal. For a buy signal, the Stochastic RSI should cross above its signal line (typically a 3-period moving average of the Stochastic RSI). For a sell signal, the Stochastic RSI should cross below its signal line.
- Price Action Confirmation: While the indicators provide valuable information, it's important to confirm the signal with price action. For a buy signal, look for bullish candlestick patterns or a break above a recent resistance level. For a sell signal, look for bearish candlestick patterns or a break below a recent support level.
- Trend Con It's crucial to consider the overall trend of the asset. In a strong uptrend, oversold signals should be viewed with caution, as they may represent temporary pullbacks before the trend resumes. Conversely, in a strong downtrend, overbought signals should be viewed with caution.
Chart Example
Consider a hypothetical chart example. Suppose an asset's price has been trending downwards, and the RSI falls below 30, indicating an oversold condition. Simultaneously, the Stochastic RSI also dips below 20, confirming the oversold signal. Furthermore, the Stochastic RSI crosses above its signal line, providing additional confirmation. Finally, a bullish candlestick pattern forms near a support level. This confluence of factors would suggest a high-probability buying opportunity.
Entry & Exit Rules
Once a valid setup has been identified, it's important to establish clear entry and exit rules to manage and maximize potential profits.
Entry Points
The entry point should be strategically determined to capitalize on the anticipated price movement. Here are some common entry strategies:
- Entry on Confirmation: A conservative approach is to enter the trade only after confirmation from price action. For a buy signal, this could be after a bullish candlestick pattern forms or the price breaks above a recent resistance level. For a sell signal, this could be after a bearish candlestick pattern forms or the price breaks below a recent support level.
- Entry on Stochastic RSI Crossover: A more aggressive approach is to enter the trade when the Stochastic RSI crosses above its signal line for a buy signal, or below its signal line for a sell signal. This allows for potentially earlier entry, but also increases the risk of false signals.
- Entry on Retracement: A common strategy is to wait for a retracement after the initial signal. For a buy signal, wait for the price to pull back slightly after the Stochastic RSI crossover. This allows for a potentially better entry price. For a sell signal, wait for the price to rally slightly after the Stochastic RSI crossover.
Setting Stop-Loss Orders
A stop-loss order is essential to limit potential losses in case the market moves against the trade. Here are some common stop-loss placement strategies:
- Below Recent Swing Low: For a buy trade, place the stop-loss order below the recent swing low. This ensures that the trade is exited if the price breaks below a significant support level.
- Above Recent Swing High: For a sell trade, place the stop-loss order above the recent swing high. This ensures that the trade is exited if the price breaks above a significant resistance level.
- Based on ATR: The Average True Range (ATR) can be used to determine the volatility of the asset. A multiple of the ATR can be used to set the stop-loss order, ensuring that it is appropriately sized based on the asset's volatility.
Profit Targets
Setting profit targets is crucial for capturing gains and preventing emotions from clouding judgment. Here are some common profit-taking strategies:
- Based on Risk-Reward Ratio: A common approach is to set the profit target based on a predetermined risk-reward ratio. For example, if the stop-loss order is placed 10 pips away from the entry point, the profit target could be set 20 pips away, resulting in a 1:2 risk-reward ratio.
- Based on Recent Swing Highs/Lows: For a buy trade, the profit target could be set near a recent swing high. For a sell trade, the profit target could be set near a recent swing low.
- Using Fibonacci Levels: Fibonacci retracement or extension levels can be used to identify potential areas of support and resistance, which can then be used as profit targets.
- Trailing Stop-Loss: A trailing stop-loss order can be used to lock in profits as the price moves in the desired direction. The stop-loss order is automatically adjusted as the price increases for a buy trade, or decreases for a sell trade.
Risk Management Tips
Effective analysis necessitates robust analysis protocols to protect investment capital and enhance long-term analysis performance.
Filtering Signals
The combined RSI and Stochastic RSI setup can generate numerous signals, some of which may be unreliable. It's important to filter these signals to identify the highest probability trades. Here are some filtering techniques:
- Volume Confirmation: High volume during a breakout or breakdown can confirm the validity of the signal. Low volume may indicate a false breakout.
- Candlestick Pattern Confirmation: Certain candlestick patterns can provide additional confirmation of the signal. For example, a bullish engulfing pattern after an oversold signal can strengthen the buy signal.
- Trend Confirmation: Trade in the direction of the overall trend. Avoid taking buy trades in a strong downtrend, and avoid taking sell trades in a strong uptrend.
- News Events: Be cautious of trading during major news events, as these can cause significant price volatility and lead to false signals.
Backtesting
Backtesting is the process of testing a analysis on historical data to evaluate its effectiveness. This is a crucial step in determining whether a strategy is likely to be profitable in the future. When backtesting the combined RSI and Stochastic RSI strategy, it's important to:
- Use a Large Dataset: Backtest the strategy on a large dataset of historical prices to ensure that the results are statistically significant.
- Test Different Timeframes: Test the strategy on different timeframes to determine which timeframe is most suitable for the asset being traded.
- Account for Transaction Costs: Include transaction costs, such as commissions and spreads, in the backtesting results.
- Optimize Parameters: Optimize the parameters of the strategy, such as the RSI and Stochastic RSI periods, to improve its performance.
Avoiding False Breakouts
False breakouts can be a common occurrence in technical analysis. These occur when the price breaks above a resistance level or below a support level, but then quickly reverses direction. To avoid false breakouts when using the combined RSI and Stochastic RSI strategy:
- Wait for Confirmation: Wait for confirmation from price action before entering a trade. A confirmed breakout is typically followed by a sustained price movement in the direction of the breakout.
- Use Volume Confirmation: High volume during a breakout can confirm the validity of the breakout. Low volume may indicate a false breakout.
- Consider Market Con Consider the overall market context before entering a trade. For example, a breakout that occurs during a period of low volatility may be more likely to be a false breakout.
Conclusion
The combination of the Relative Strength Index (RSI) and the Stochastic RSI offers a powerful approach to analysis, providing a more nuanced and potentially profitable perspective than either indicator used in isolation. The RSI identifies overbought and oversold conditions based on price action, while the Stochastic RSI refines these signals by measuring the RSI's momentum. By combining these two indicators, analysis can filter out false signals, identify early entry points, and confirm potential trend reversals.
This approach is most effective during periods of market consolidation or sideways movement, where price action is less predictable. During these times, the combined RSI and Stochastic RSI can help identify potential breakout opportunities and reversals. However, it's important to remember that no technique is foolproof. The key to success lies in disciplined application, robust analysis management, and a thorough understanding of market dynamics.
Always practice responsible financial conduct. Prior to implementing any new analysis, it is highly recommended to conduct thorough testing with a demo fund. This allows for familiarization with the strategies and optimization for individual preferences without exposing real capital to unnecessary risk. Careful preparation and continuous learning are essential components of successful navigation within the financial markets.
🤖 AI-Powered Trading Indicators
Win Up To 93% of Trades With the #1 Most Profitable Indicators
Unlock the power of artificial intelligence and take your trading to the next level. Our VIP Trading Indicators are designed to help you dominate any market — Forex, Crypto, Stocks — with up to 93% accuracy.
Gain instant 24/7 access to 5+ powerful, battle-tested indicators built to predict market trends with precision. Whether you're a beginner or an expert, these tools are optimized for all skill levels and work on any device.
✓ 30-Day Money Back Guarantee — Try Risk-Free!