
The financial marketplace is a complex arena where success often hinges on identifying and capitalizing on emerging trends. Traders employ a variety of strategies, many of which rely on technical analysis and trading indicators to forecast price movements. This exploration delves into the MACD Angle, a powerful tool that, when combined with signal line confirmation, can enhance trend identification and improve the accuracy of trading decisions. The MACD Angle offers a unique perspective on momentum, complementing the insights gained from traditional MACD analysis.
Understanding the MACD and Its Components
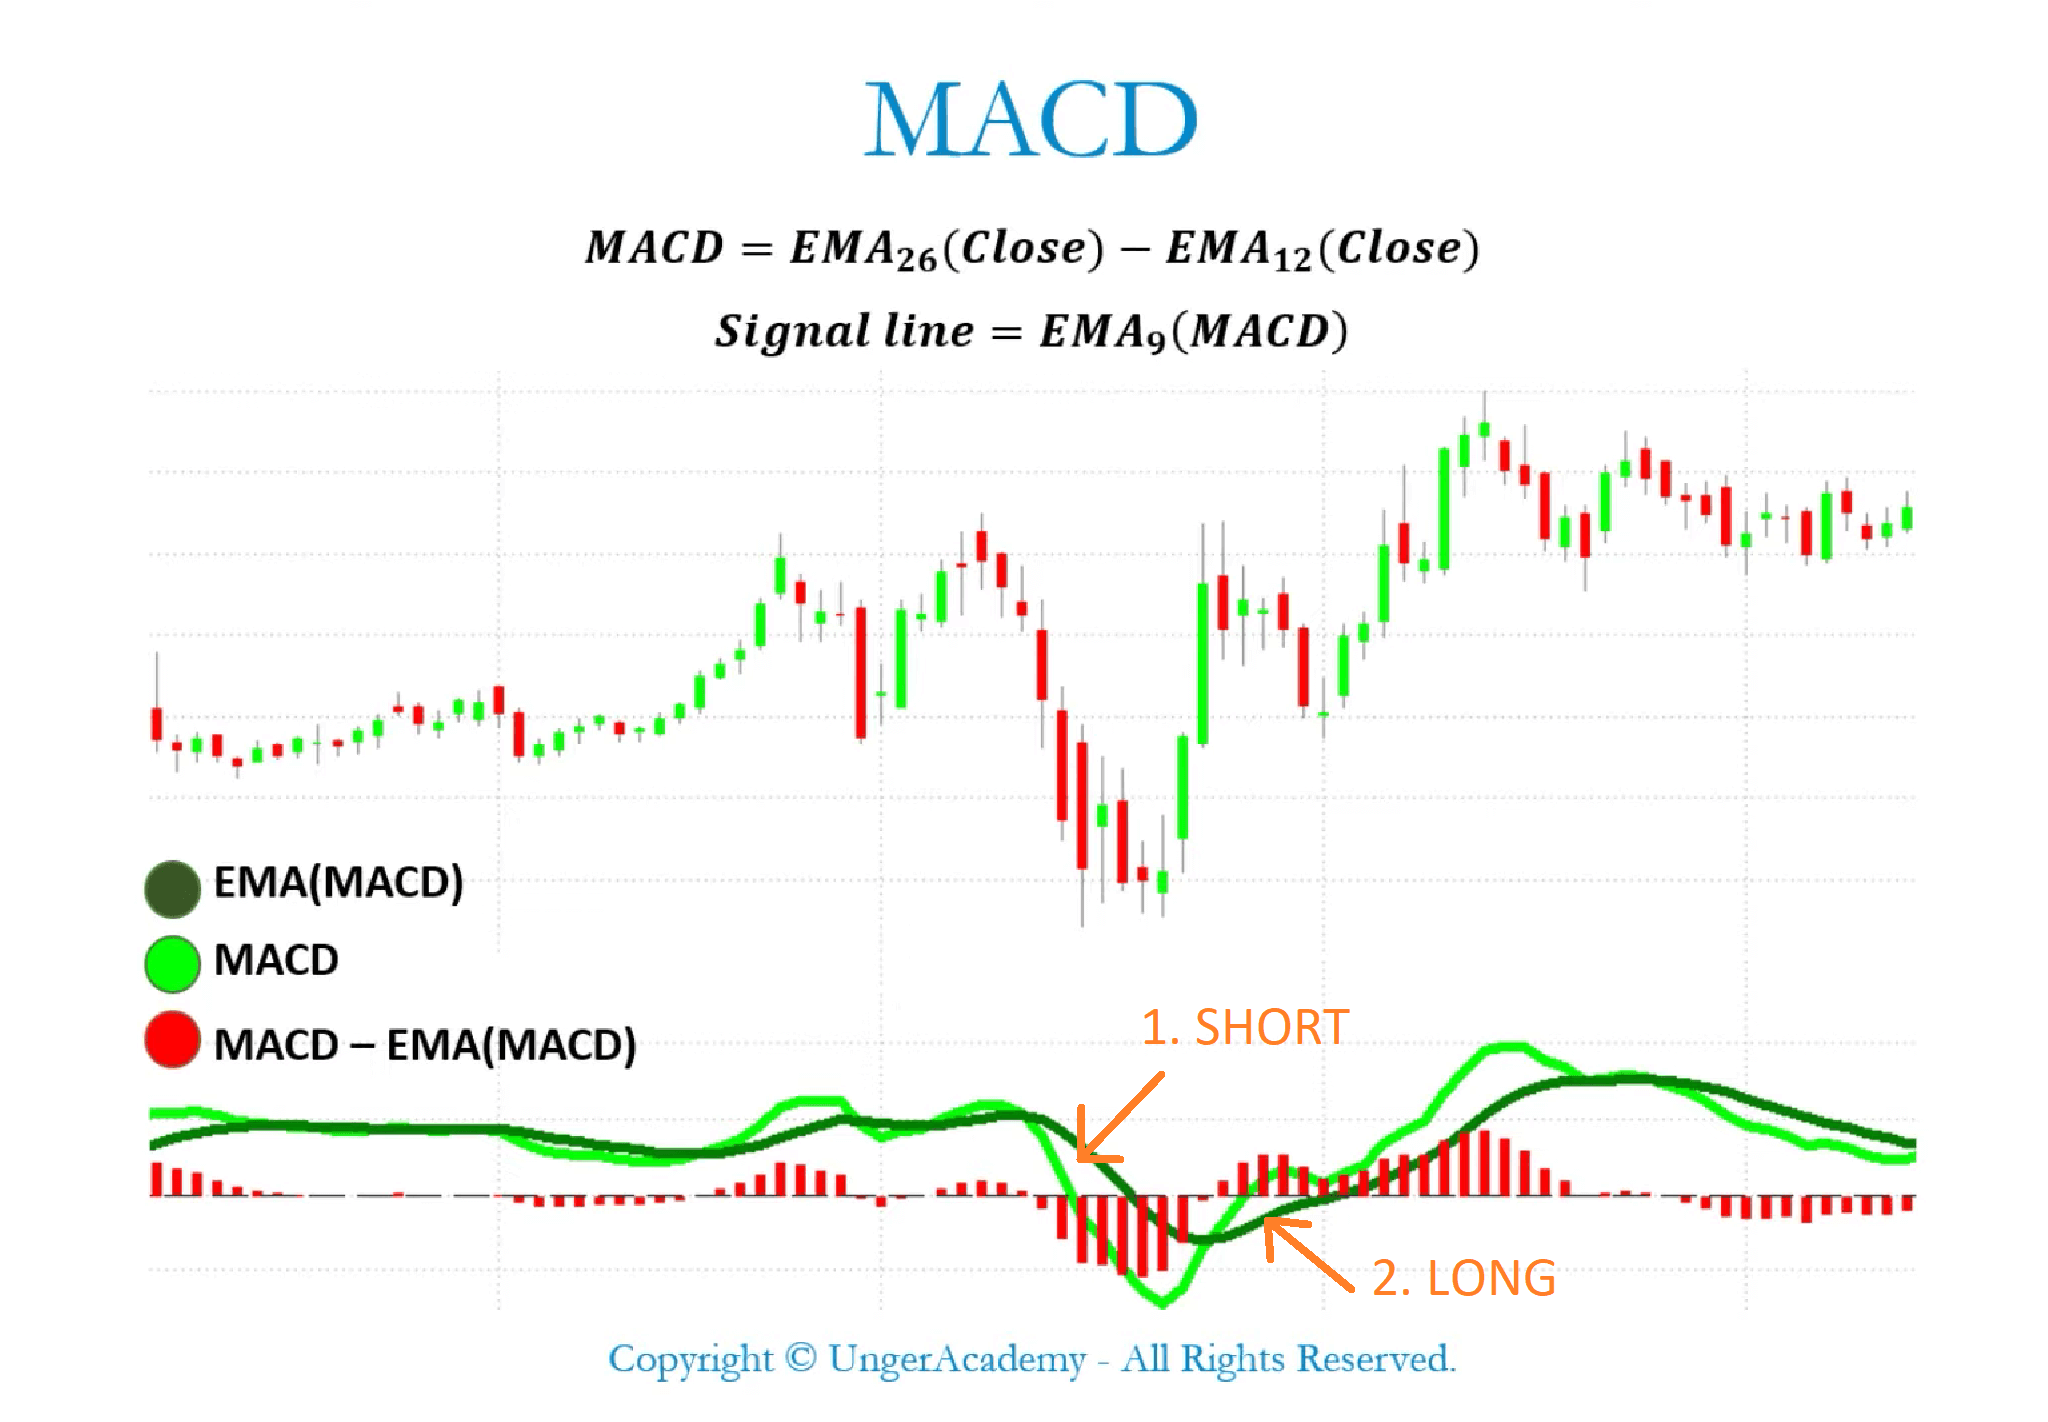
The Moving Average Convergence Divergence (MACD) is a momentum indicator that illustrates the relationship between two moving averages of a security’s price. Developed by Gerald Appel in the late 1970s, it remains a widely used tool among traders. The MACD comprises three primary components:
- MACD Line: Calculated by subtracting the 26-period Exponential Moving Average (EMA) from the 12-period EMA. This line oscillates above and below zero, indicating the relative position of the two moving averages.
- Signal Line: A 9-period EMA of the MACD line. It acts as a trigger for buy and sell signals.
- MACD Histogram: Represents the difference between the MACD line and the signal line. It visually displays the momentum of the MACD line relative to its signal line.
Traditionally, traders use crossovers of the MACD line and the signal line to generate trading signals. A bullish crossover occurs when the MACD line crosses above the signal line, suggesting a potential buying opportunity. Conversely, a bearish crossover occurs when the MACD line crosses below the signal line, indicating a potential selling opportunity. Divergences between the MACD and price action can also provide valuable insights. For example, a bullish divergence occurs when the price makes lower lows, but the MACD makes higher lows, suggesting that the downtrend is weakening. Similarly, a bearish divergence occurs when the price makes higher highs, but the MACD makes lower highs, signaling a potential trend reversal.
Introducing the MACD Angle
While traditional MACD analysis focuses on crossovers and divergences, the MACD Angle offers a different perspective by examining the slope, or angle, of the MACD line. This angle provides information about the strength and momentum of the trend. A steeper angle suggests stronger momentum, while a flatter angle indicates weakening momentum. By analyzing the MACD Angle in conjunction with signal line confirmation, traders can gain a more nuanced understanding of market dynamics and improve the accuracy of their trading decisions.
The MACD Angle essentially quantifies the rate of change of the MACD line. It measures how quickly the MACD line is rising or falling, providing insight into the acceleration or deceleration of momentum. A sharply rising MACD line, indicated by a steep positive angle, suggests that the shorter-term moving average is rapidly diverging from the longer-term moving average, signaling strong bullish momentum. Conversely, a sharply falling MACD line, indicated by a steep negative angle, suggests that the shorter-term moving average is rapidly converging towards the longer-term moving average, signaling strong bearish momentum.
Signal Line Confirmation: A Critical Component
Signal line confirmation is crucial for validating the signals generated by the MACD Angle. A rising MACD Angle alone does not necessarily guarantee a profitable trade. It is essential to confirm the signal with a crossover of the MACD line above the signal line. This crossover provides additional confirmation that the bullish momentum is likely to continue. Similarly, a falling MACD Angle should be confirmed with a crossover of the MACD line below the signal line to validate the bearish signal.
The signal line acts as a smoothing mechanism, filtering out some of the noise and volatility associated with the MACD line. By requiring confirmation from the signal line, traders can reduce the risk of false signals and improve the overall accuracy of their trading strategies. The combination of the MACD Angle and signal line confirmation provides a more robust and reliable indicator of potential trading opportunities.
Identifying Trading Opportunities with MACD Angle and Signal Confirmation
The combination of the MACD Angle and signal line confirmation can be used to identify various trading opportunities. Here are some specific scenarios:
- Trend Initiation: When the MACD line crosses above the signal line and the MACD Angle is steeply positive, it can signal the beginning of a new uptrend. This combination suggests that the bullish momentum is strong and likely to continue.
- Trend Continuation: During an existing uptrend, a temporary pullback may cause the MACD Angle to flatten or even turn negative. However, if the MACD line remains above the signal line and the MACD Angle subsequently turns positive again, it can signal a continuation of the uptrend.
- Trend Reversal: When the MACD line crosses below the signal line and the MACD Angle is steeply negative, it can signal the beginning of a new downtrend. This combination suggests that the bearish momentum is strong and likely to continue. Conversely, during an existing downtrend, a temporary rally may cause the MACD Angle to flatten or even turn positive. However, if the MACD line remains below the signal line and the MACD Angle subsequently turns negative again, it can signal a continuation of the downtrend.
- Early Warning Signals: A divergence between the MACD Angle and price action can provide an early warning of a potential trend reversal. For example, if the price is making higher highs, but the MACD Angle is making lower highs, it could indicate that the uptrend is losing momentum and may soon reverse.
It is important to note that no trading indicator is foolproof, and the MACD Angle and signal line confirmation should be used in conjunction with other technical analysis tools and risk management strategies. It is also crucial to consider the overall market context and the specific characteristics of the security being traded.
Enhancing Accuracy with Additional Trading Indicators
To further enhance the accuracy of trading signals generated by the MACD Angle and signal line confirmation, traders can incorporate other technical analysis tools and indicators. Some commonly used complementary indicators include:
- Relative Strength Index (RSI): An indicator that measures the magnitude of recent price changes to evaluate overbought or oversold conditions in the price of a stock or other asset. It ranges from 0 to 100, with readings above 70 typically indicating overbought conditions and readings below 30 indicating oversold conditions.
- Moving Averages: Used to smooth out price data and identify the direction of the trend. Common types of moving averages include Simple Moving Averages (SMA) and Exponential Moving Averages (EMA).
- Volume: A measure of the number of shares or contracts traded in a security during a given period. High volume typically confirms the strength of a trend, while low volume may indicate a lack of conviction.
- Fibonacci Retracements: Used to identify potential support and resistance levels based on Fibonacci ratios. These levels can be used to set profit targets and stop-loss orders.
- Chart Patterns: Visual formations on a price chart that can provide insights into potential price movements. Common chart patterns include head and shoulders, double tops, and triangles.
By combining the MACD Angle and signal line confirmation with these additional indicators, traders can create a more comprehensive and robust trading strategy.
Risk Management Strategies
Effective risk management is essential for successful trading. Even the most accurate trading strategies can result in losses if not implemented with proper risk management techniques. Here are some key risk management strategies to consider when trading with the MACD Angle and signal line confirmation:
- Stop-Loss Orders: A stop-loss order is an order to sell a security when it reaches a certain price. This helps to limit potential losses if the trade moves against the trader.
- Position Sizing: Determining the appropriate size of each trade based on the trader’s account size and risk tolerance. Avoid risking more than a small percentage of the account on any single trade.
- Diversification: Spreading investments across different securities and asset classes to reduce overall risk.
- Profit Targets: Setting a target price at which to exit a profitable trade. This helps to ensure that profits are realized and not given back to the market.
- Trailing Stops: A trailing stop is a stop-loss order that adjusts as the price of the security moves in the trader’s favor. This helps to protect profits while allowing the trade to continue to run if the trend persists.
By implementing these risk management strategies, traders can protect their capital and improve their long-term trading performance.
Backtesting and Optimization
Before implementing any trading strategy with real money, it is essential to backtest it using historical data. Backtesting involves applying the strategy to past price data to see how it would have performed. This can help to identify potential weaknesses in the strategy and to optimize its parameters for different market conditions.
When backtesting the MACD Angle and signal line confirmation strategy, consider the following factors:
- Timeframe: Test the strategy on different timeframes to see how it performs in different market conditions.
- Securities: Test the strategy on different securities to see how it performs across different asset classes.
- Parameters: Experiment with different parameters for the MACD and signal line to see which settings produce the best results.
- Risk Management: Evaluate the impact of different risk management strategies on the overall performance of the strategy.
By carefully backtesting and optimizing the strategy, traders can increase their confidence in its potential and improve their chances of success.
Real-World Examples
To illustrate the application of the MACD Angle and signal line confirmation, consider a hypothetical example. Suppose a trader is analyzing a stock that has been in a consolidation phase for several weeks. The MACD line has been oscillating around the zero line, and the MACD Angle has been relatively flat. Suddenly, the price breaks above a key resistance level, and the MACD line crosses above the signal line. At the same time, the MACD Angle turns steeply positive, indicating a surge in bullish momentum. This combination of factors suggests that the stock is likely to enter a new uptrend. The trader could enter a long position with a stop-loss order placed below the recent swing low. The profit target could be set based on Fibonacci retracement levels or previous resistance levels.
Another example could involve a stock that has been in an established uptrend. The MACD line is above the signal line, and the MACD Angle is positive. However, the price begins to stall, and the MACD Angle starts to flatten. This could indicate that the uptrend is losing momentum. If the MACD line then crosses below the signal line, and the MACD Angle turns negative, it could signal a potential trend reversal. The trader could exit their long position or even initiate a short position with a stop-loss order placed above the recent swing high. The profit target could be set based on previous support levels or Fibonacci retracement levels.
These examples highlight the potential of the MACD Angle and signal line confirmation to identify trading opportunities in various market conditions.
The Psychology of Trading with Indicators
While technical analysis and trading indicators can provide valuable insights into market dynamics, it is important to recognize the role of psychology in trading. Fear and greed can often cloud judgment and lead to impulsive decisions. It is crucial to maintain a disciplined approach and to stick to the trading plan, even when emotions are running high.
Here are some tips for managing emotions in trading:
- Have a Trading Plan: Develop a detailed trading plan that outlines the entry and exit rules, risk management strategies, and profit targets.
- Stick to the Plan: Follow the trading plan consistently, even when emotions are strong.
- Manage Risk: Use stop-loss orders and position sizing to limit potential losses.
- Don’t Overtrade: Avoid trading too frequently, as this can lead to fatigue and impulsive decisions.
- Take Breaks: Step away from the computer regularly to clear your head and avoid burnout.
- Learn from Mistakes: Analyze past trades to identify mistakes and learn from them.
By managing emotions and maintaining a disciplined approach, traders can improve their decision-making and increase their chances of success.
Conclusion
The MACD Angle, when combined with signal line confirmation, offers a powerful tool for identifying and capitalizing on market trends. By analyzing the slope of the MACD line and requiring confirmation from the signal line, traders can gain a more nuanced understanding of momentum and improve the accuracy of their trading decisions. While this indicator is a valuable asset, it should be used in conjunction with other technical analysis tools, risk management strategies, and a disciplined approach to trading. The effectiveness of this strategy is most pronounced during periods of market consolidation, where the identification of breakout direction is key. Remember to thoroughly backtest and optimize the strategy before implementing it with real capital.
Understanding Trading Indicators such as the MACD Angle is just one piece of the puzzle. Continuous learning and adaptation are essential for long-term success in the dynamic financial marketplace. The information provided herein serves as a starting point for further exploration and refinement. Ultimately, the most effective trading strategies are those that are tailored to individual preferences, risk tolerance, and market conditions.
Before engaging in real-money trading, it is highly recommended to test the MACD Angle strategy, as well as any other strategy, in a demo account. This allows for practice and refinement without risking actual capital. Furthermore, always remember that past performance is not indicative of future results, and there is no guarantee of profits in the financial marketplace.
🤖 AI-Powered Trading Indicators
Win Up To 93% of Trades With the #1 Most Profitable Indicators
Unlock the power of artificial intelligence and take your trading to the next level. Our VIP Trading Indicators are designed to help you dominate any market — Forex, Crypto, Stocks — with up to 93% accuracy.
Gain instant 24/7 access to 5+ powerful, battle-tested indicators built to predict market trends with precision. Whether you're a beginner or an expert, these tools are optimized for all skill levels and work on any device.
✓ 30-Day Money Back Guarantee — Try Risk-Free!