
In the arena of technical analysis, traders employ a wide array of tools to anticipate future price movements and formulate informed decisions. A cornerstone of this approach involves utilizing trading indicators, mathematical calculations based on historical data, which are used to forecast market direction. One such strategy, often referred to as the "RSI Slingshot," combines the Relative Strength Index (RSI) with Bollinger Bands to identify potential reversal points with increased precision. This method seeks to capitalize on periods of market consolidation, followed by high-probability breakouts, offering opportunities for both short-term and swing traders. By understanding the underlying principles of each indicator and their combined signals, one can potentially enhance timing and improve overall trading performance.
Understanding the Tools
The RSI Slingshot strategy relies on two primary components: the Relative Strength Index (RSI) and Bollinger Bands. A thorough understanding of each indicator is essential before attempting to combine them effectively.
Quick Refresher: What is RSI?
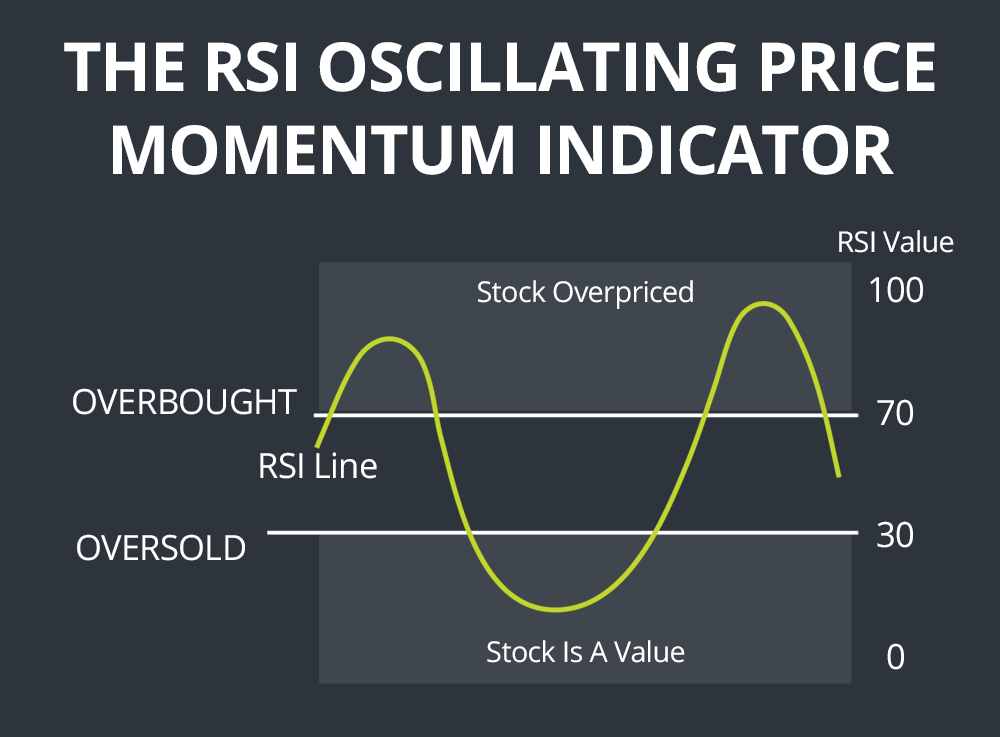
The Relative Strength Index (RSI) is a momentum oscillator used in technical analysis that measures the speed and change of price movements. Developed by J. Welles Wilder, it oscillates between 0 and 100. Traditionally, RSI is considered overbought when above 70 and oversold when below
30. Signals are generated when the RSI diverges from the price, fails to reach a previous high or low, or crosses above or below the 50 level. The RSI is designed to indicate whether an asset is overbought or oversold, potentially signaling a reversal. However, it is important to remember that overbought does not necessarily mean a sell signal, and oversold does not automatically mean a buy signal. The RSI is most effective when used in conjunction with other trading indicators.
How Bollinger Bands Work and What a “Squeeze” Means
Bollinger Bands, developed by John Bollinger, consist of a simple moving average (SMA) and two bands plotted at a standard deviation above and below the SMA. These bands dynamically widen and contract based on market volatility. The default setting typically uses a 20-period SMA and two standard deviations. A "squeeze" occurs when the Bollinger Bands contract, indicating a period of low volatility. This contraction suggests that the market is consolidating, and a significant price movement is likely to occur in the near future. The premise behind the squeeze is that periods of low volatility are often followed by periods of high volatility, and the direction of the breakout often determines the future trend.
Bollinger Bands are commonly used to identify potential overbought or oversold conditions. When the price reaches the upper band, it may indicate an overbought condition, while the price reaching the lower band may indicate an oversold condition. However, like the RSI, these signals should be confirmed by other trading indicators and price action. Bollinger Bands also provide dynamic support and resistance levels, as the bands adjust to changing market volatility.
Why Volatility Contraction Precedes Expansion
The concept of volatility contraction preceding expansion is rooted in market psychology. Periods of low volatility, characterized by a Bollinger Band squeeze, often occur when there is indecision or equilibrium between buyers and sellers. This indecision leads to a narrowing of the trading range and a decrease in price fluctuations. However, this state of equilibrium is typically unsustainable. Eventually, a catalyst, such as news, earnings announcements, or a shift in sentiment, breaks the stalemate. When this happens, pent-up energy is released, leading to a surge in volatility and a significant price movement. Traders watch for the Bollinger Band squeeze as a signal that a potential breakout is imminent, providing an opportunity to capitalize on the subsequent volatility expansion. Understanding this principle is crucial for effectively utilizing the RSI Slingshot strategy.
Identifying the Setup
Identifying the RSI Slingshot setup requires a keen eye and a methodical approach. It involves analyzing both the Bollinger Bands and the RSI to confirm specific conditions.
Conditions for a Valid Squeeze
The primary condition for a valid squeeze is a noticeable contraction of the Bollinger Bands. This contraction should be visually apparent on the chart, with the upper and lower bands moving closer together. There is no definitive measurement for how tight the bands need to be, but a general guideline is that the distance between the bands should be at its narrowest point relative to recent price action. It is important to consider the timeframe being analyzed. A squeeze on a daily chart may be more significant than a squeeze on a 5-minute chart. To confirm the squeeze, traders often use indicators that measure volatility, such as Average True Range (ATR), to verify that volatility is indeed at a low point.
Another condition is that the price action within the squeeze should be relatively sideways or consolidating. This indicates that neither buyers nor sellers are in control, creating the potential for a future breakout. A squeeze that occurs during a strong uptrend or downtrend is less likely to result in a reliable RSI Slingshot setup.
RSI in Neutral → Overbought/Oversold Transition
The RSI plays a crucial role in confirming the potential direction of the breakout. During the squeeze, the RSI should ideally be hovering around the neutral level of 50. This indicates that momentum is not strongly biased in either direction. The key is to then observe the RSI's transition as the price begins to break out of the squeeze. If the price breaks above the upper Bollinger Band and the RSI moves from the neutral zone into overbought territory (above 70), it provides a bullish confirmation signal. Conversely, if the price breaks below the lower Bollinger Band and the RSI moves from the neutral zone into oversold territory (below 30), it provides a bearish confirmation signal. It's important to note that waiting for the RSI to confirm the breakout, rather than anticipating it, can help filter out false signals.
RSI divergence can also be a powerful component of the setup. For example, if the price is making lower lows but the RSI is making higher lows during the squeeze, it could indicate a potential bullish reversal and a subsequent breakout to the upside. The opposite is true for bearish divergence.
Chart Example of Squeeze + RSI Divergence
Imagine a stock chart displaying a period of sideways consolidation. The Bollinger Bands have visibly contracted, indicating a squeeze. During this period, the price makes a series of slightly lower lows, but the RSI forms higher lows, creating a bullish divergence. Suddenly, the price breaks above the upper Bollinger Band, and the RSI crosses above 70, confirming the bullish breakout. This scenario exemplifies the RSI Slingshot setup, providing a high-probability entry point for a long position. The combination of the squeeze, RSI divergence, and the breakout confirmation increases the likelihood of a successful trade.
Entry & Exit Rules
Once the RSI Slingshot setup has been identified, establishing clear entry and exit rules is essential for managing risk and maximizing potential profits.
Entry When Price Breaks Upper/Lower Bollinger Band with RSI Confirmation
The entry point for the RSI Slingshot strategy is triggered when the price breaks above the upper Bollinger Band or below the lower Bollinger Band, accompanied by RSI confirmation. A break above the upper band with RSI moving into overbought territory signals a potential long entry. A break below the lower band with RSI moving into oversold territory signals a potential short entry. It is crucial to wait for the candle to close above or below the Bollinger Band to confirm the breakout. This helps to avoid false breakouts that may occur due to temporary price fluctuations. Some traders prefer to use a more conservative approach, waiting for a retest of the broken Bollinger Band as support or resistance before entering the trade.
Order entry can be made as a market order when the conditions are met, or as a limit order set slightly above the high of the breakout candle for a long entry, or slightly below the low of the breakout candle for a short entry.
Setting Stop-Loss Below Squeeze Base
Protecting capital is paramount in trading, and a well-placed stop-loss order is essential for risk management. In the RSI Slingshot strategy, the stop-loss is typically placed below the base of the squeeze for long positions, or above the base of the squeeze for short positions. The "base" refers to the lowest point reached during the consolidation period prior to the breakout. This placement provides a buffer against potential false breakouts and ensures that the trade is exited if the price reverses and invalidates the setup. The exact distance of the stop-loss from the entry point depends on individual risk tolerance and the volatility of the asset being traded. A common approach is to use a multiple of the Average True Range (ATR) to determine the appropriate stop-loss distance. For example, a stop-loss could be set at 1.5 or 2 times the ATR below the entry point for a long position.
Profit Targets Based on ATR or Recent Swing Highs/Lows
Determining appropriate profit targets is just as important as setting stop-loss orders. In the RSI Slingshot strategy, profit targets can be based on several factors, including the Average True Range (ATR) or recent swing highs and lows. Using ATR involves projecting a potential price movement based on the asset's average volatility. For example, a profit target could be set at 2 or 3 times the ATR from the entry point. Another approach is to identify recent swing highs for long positions or swing lows for short positions and use them as potential profit targets. These levels often act as areas of resistance or support, respectively. A more advanced technique involves using Fibonacci extensions to project potential price targets based on the Fibonacci sequence. It is important to consider the overall market context and potential resistance or support levels when setting profit targets. Traders may also choose to scale out of their positions as the price approaches these targets, taking partial profits along the way to lock in gains.
Risk Management Tips
Even with a well-defined strategy, effective risk management is crucial for long-term trading success. Several techniques can be used to enhance the reliability of the RSI Slingshot strategy and mitigate potential losses.
Filtering Signals with Volume or Candlestick Confirmation
Adding volume analysis to the RSI Slingshot strategy can help filter out false signals and confirm the validity of breakouts. A strong breakout should be accompanied by a significant increase in volume, indicating strong buying or selling pressure. A breakout with low volume may be a sign of a false breakout and should be approached with caution. Candlestick patterns can also provide valuable confirmation. For example, a bullish engulfing pattern or a piercing pattern near the lower Bollinger Band can strengthen the bullish signal, while a bearish engulfing pattern or a dark cloud cover pattern near the upper Bollinger Band can strengthen the bearish signal. Combining volume and candlestick analysis with the RSI Slingshot strategy can increase the probability of successful trades.
Backtesting the Strategy Over Multiple Timeframes
Before implementing any trading strategy, it is essential to backtest it over historical data to assess its performance and identify potential weaknesses. Backtesting involves simulating trades based on the strategy's rules and analyzing the resulting profit and loss statements. This process can help determine the strategy's win rate, average profit per trade, and maximum drawdown. The RSI Slingshot strategy should be backtested over multiple timeframes, such as daily, hourly, and 15-minute charts, to understand its performance under different market conditions. Backtesting can also help optimize the strategy's parameters, such as the Bollinger Band settings and RSI overbought/oversold levels. It is important to note that past performance is not necessarily indicative of future results, but backtesting can provide valuable insights into the strategy's potential and help refine its rules.
Avoiding False Breakouts During News Events
News events can cause significant price volatility and lead to false breakouts, especially during periods of consolidation. It is advisable to avoid trading the RSI Slingshot strategy during major news announcements, such as earnings reports, economic data releases, and geopolitical events. These events can cause the price to spike in either direction, triggering stop-loss orders or leading to premature entries. Traders should be aware of the economic calendar and avoid trading during these periods. Alternatively, one can reduce the position size or widen the stop-loss to account for the increased volatility. Waiting for the market to settle down after a news event before entering a trade can help avoid false breakouts and increase the probability of success.
Conclusion
The combination of the Relative Strength Index (RSI) and Bollinger Band squeeze offers a robust framework for identifying potential price reversals. The RSI provides valuable insights into momentum and potential overbought/oversold conditions, while the Bollinger Band squeeze identifies periods of low volatility that often precede significant price movements. When these two trading indicators are used together, they can create a high-probability trading setup.
This strategy is most effective during periods of market consolidation, where the price is range-bound and volatility is low. This allows the Bollinger Bands to contract, creating the squeeze, and the RSI to oscillate between neutral levels. When the market is trending strongly in one direction, the RSI Slingshot strategy may be less reliable. Therefore, understanding the overall market context is crucial for successfully implementing this strategy.
Before risking real capital, it is highly recommended to test the RSI Slingshot strategy with a demo account. This allows one to become familiar with the setup, practice identifying the conditions, and refine entry and exit rules without the risk of financial loss. Experimenting with different parameters and risk management techniques can help optimize the strategy for individual trading style and risk tolerance.
🤖 AI-Powered Trading Indicators
Win Up To 93% of Trades With the #1 Most Profitable Indicators
Unlock the power of artificial intelligence and take your trading to the next level. Our VIP Trading Indicators are designed to help you dominate any market — Forex, Crypto, Stocks — with up to 93% accuracy.
Gain instant 24/7 access to 5+ powerful, battle-tested indicators built to predict market trends with precision. Whether you're a beginner or an expert, these tools are optimized for all skill levels and work on any device.
✓ 30-Day Money Back Guarantee — Try Risk-Free!